Introduction
Most mid-market and PE-backed companies are running dozens of technology vendor contracts at any given time — cloud commitments, SaaS subscriptions, enterprise licenses, IT support agreements — and managing them through spreadsheets and email reminders. The result is predictable: auto-renewals trigger without review, duplicate tools accumulate across departments, and negotiation windows pass before anyone notices.
According to Zylo's 2025 SaaS Management Index, organizations waste an average of $21 million annually on unused SaaS licenses. Meanwhile, Flexera's 2025 State of ITAM report found that only 43% of organizations have complete visibility across their technology stack. Those two numbers together describe the problem precisely: massive spend, minimal control.
This guide walks procurement and finance leaders through a practical framework for technology spend analysis and vendor contract renewal — covering data consolidation, usage benchmarking, and negotiation execution — so every renewal becomes a deliberate decision, not a default.
Key Takeaways
- Centralize all tech vendor spend data before taking any action — shadow IT included
- Classify vendors by spend tier and criticality to prioritize negotiation effort
- Actual usage vs. contracted volume should be validated for every SaaS and cloud commitment before renewal
- Build a 90/60/30-day renewal calendar with assigned contract owners
- Use benchmarking data and usage analysis to negotiate on commercial terms, not relationships
What Is Technology Spend Analysis?
Technology spend analysis is the process of collecting, categorizing, and evaluating all expenditures related to technology vendors — SaaS subscriptions, cloud services, IT support contracts, hardware leases, and enterprise licenses — to uncover inefficiencies, reduce costs, and align spending with business priorities.
Why Tech Spend Is Uniquely Difficult to Manage
Unlike categories such as office supplies or logistics, technology spend carries three structural problems:
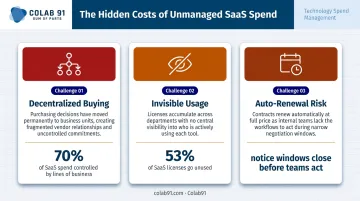
- Decentralized buying: Lines of business control 70% of SaaS spend, while IT manages only 26%. That means most purchases happen outside formal procurement channels.
- Invisible usage: A signed contract says nothing about whether anyone is actually using the tool. 53% of SaaS licenses go unused, but that waste only surfaces through active monitoring.
- Vendor-favorable auto-renewal terms: Contracts renew automatically on the vendor's schedule unless someone acts. Miss a notice window and the negotiation window closes entirely.
Audit vs. Ongoing Practice
A one-time audit finds what you have today. An ongoing spend analysis practice keeps that visibility current — so you act before renewal deadlines, not scrambling after them. In technology, that timing difference is consequential: vendor terms shift, tools get replaced, and new shadow spend accumulates quarter over quarter.
How to Conduct a Technology Spend Analysis
Step 1: Consolidate All Spend Data
Build a single source of truth by pulling data from:
- Purchase orders and vendor invoices
- Executed contracts and order forms
- IT asset management systems
- AP feeds and ERP exports
- Employee expense reports and corporate card transactions
Shadow IT (tools purchased without IT or procurement approval) must be captured here. Without it, the spend baseline is fundamentally incomplete.
Colab91's spend analytics platform addresses this consolidation challenge directly: it cleanses and classifies spend to a standard taxonomy (UNSPSC or client-specific), then enriches records with contract terms and addressable spend percentages before any analysis begins.
Step 2: Classify Vendors by Tier and Category
Use a two-axis classification:
By spend volume:
- Strategic (top vendors by annual value)
- Preferred (mid-tier with active relationships)
- Tail (low-value, often unmanaged)
By function:
- Cloud and infrastructure
- SaaS productivity
- Cybersecurity
- Data and analytics
- IT support and maintenance
This classification determines how much negotiation attention each vendor deserves and surfaces functional overlap — two vendors solving the same problem is an immediate consolidation signal.
Step 3: Map Actual Usage to Contracted Commitments
This step separates technology spend analysis from general procurement analysis. For every significant vendor:
- Pull active user counts vs. licensed seat counts
- Compare compute consumption vs. committed cloud volume
- Assess feature adoption vs. contracted tier
Unused seats and underused cloud commitments are direct savings opportunities, and documented evidence for right-sizing conversations at renewal. Estimated wasted IaaS/PaaS cloud spend now sits at 29% of total cloud investment, making this step valuable for organizations with significant infrastructure commitments.
One caution: vendor-provided utilization reports can present usage favorably. Independent monitoring through IT asset management tools or a dedicated analytics function gives a more accurate baseline.
Step 4: Benchmark Pricing Against Market Rates
Once spend and usage are understood, benchmark current pricing against what comparable organizations pay for the same tools. Benchmarking data sources include:
- Procurement analytics platforms with deal comparison databases
- Advisory firms that track negotiated rates across clients
- Industry reports published by analyst firms
Going into a renewal without a benchmark means negotiating without knowing the market price. That's a structural disadvantage no preparation can fully recover from.
Step 5: Identify Consolidation and Optimization Opportunities
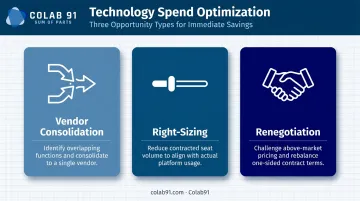
Three specific opportunity types to look for:
- Vendor consolidation — two vendors serving overlapping functions, where one can be eliminated
- Right-sizing — contracted volume exceeds actual usage, warranting a seat or tier reduction
- Renegotiation — pricing is above market or contract terms are one-sided
How consistently this analysis gets done depends largely on whether the organization has a dedicated function running it. Mid-market and PE-backed companies that work with dedicated offshore procurement analytics teams, including those Colab91 has built for portfolio companies of Carlyle Group and TPG, can run this analysis on a continuous basis rather than relying on sporadic internal reviews. The difference is weekly or monthly intelligence cadences versus a quarterly snapshot that's already outdated by the time it lands.
Key Metrics That Matter in a Tech Spend Review
Financial Metrics
| Metric | Why It Matters |
|---|---|
| Total tech spend as % of revenue | Benchmarks your investment against industry norms |
| Spend by vendor category | Reveals where budget is concentrated and where rationalization is possible |
| % of spend under active contract management | Industry best-in-class is 80%+ on-contract spend |
| Cost per user/unit by tool | Surfaces above-market unit pricing across the portfolio |
Operational Metrics
- Software utilization rate: Active users ÷ licensed seats — any tool below 70% warrants a right-sizing or cancellation review
- Contract coverage percentage: What share of tech spend is governed by a signed agreement — uncovered spend is uncontrolled spend
- Maverick spend rate: Purchases made outside approved channels; high rates indicate a shadow IT problem that financial metrics won't capture
A vendor with modest annual spend but 5% utilization is pure waste. Financial metrics alone won't surface it — only utilization data will.
Governance Metrics
- % of contracts with assigned owners: Without ownership, contracts default to auto-renewal by inertia
- % with documented renewal decisions: Auto-renewal is still a decision; it simply shouldn't happen by default
- Renewal lead time: Days before expiry when the team made a documented renewal or exit decision
Governance metrics are where reactive organizations get exposed. Without renewal lead time data, for example, most teams discover missed negotiation windows only after the auto-renewal has already processed.
How to Build a Vendor Contract Renewal Calendar
Why Timing Determines Leverage
Vendors have maximum leverage when a renewal date arrives and the buyer hasn't prepared an alternative. A 90-day window is the minimum preparation time for any strategic technology contract. High-value or complex agreements — cloud commitments, multi-year enterprise licenses — require six months.
Vendr's Q1 2024 SaaS Trends Report found that software renewals took 30% longer than the prior year's average of 53 days. Longer cycles compress negotiation time further.
Most SaaS contracts also require cancellation notice 30 to 90 days before term end. Reactive organizations consistently pay more than proactive ones — that notice window is where the difference shows up.
Assign Contract Ownership with a RACI Model
Without clear ownership, no one acts. A functional RACI for technology contract renewals:
- IT / Application owner: Tracks usage data and performance against expectations
- Procurement / Commercial lead: Owns negotiation strategy and commercial terms
- Finance: Provides budget alignment and financial approval
- Legal / Security: Reviews compliance clauses, data terms, and risk provisions
Every contract needs a named owner in each role. If a contract has no owner, it auto-renews.
The 90/60/30-Day Renewal Workflow
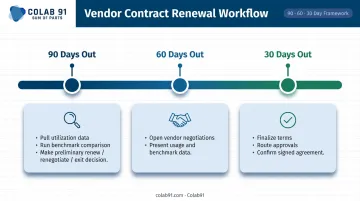
90 days out:
- Pull utilization data and compare against contracted commitments
- Run a benchmark comparison against market pricing
- Make a preliminary decision: renew, renegotiate, or exit
60 days out:
- Open negotiations with vendor alternatives documented and in hand
- Present usage data and benchmark pricing to the vendor
30 days out:
- Finalize terms
- Route for legal, finance, and executive approvals
- Confirm signed agreement or exit notice before auto-renewal triggers
Organizations that run this workflow consistently report shorter negotiation cycles and fewer forced renewals at full list price — because the vendor knows the buyer has done the work.
What a Renewal Tracking System Must Include
At minimum, every technology contract record should capture:
- Vendor name and contract owner
- Current annual contract value
- Auto-renewal date and notice period required to cancel
- Last renegotiated date
- Renewal decision status (renew / renegotiate / exit / pending)
A structured spreadsheet can handle this for organizations managing fewer than 50 technology contracts. At 50+, the manual approach breaks down — missed notice periods, stale data, and no audit trail. At that scale, dedicated contract management tools or a procurement analytics platform are required — not optional. The cost of a missed auto-renewal on a $200K contract far exceeds the cost of the tooling.
Prioritizing Which Contracts to Address First
Not all contracts deserve equal attention. Use a spend-tier matrix:
- High-value contracts with approaching renewals: Immediate priority — full 90-day workflow
- Mid-tier contracts with near-term renewals: Benchmarking-led renegotiation
- Low-value tail spend: Rationalization review — consolidate, standardize, or cancel
Spending equal effort on a $500/month tool and a $500,000/year enterprise platform is one of the most common and costly mistakes in contract management.
Turning Spend Data Into Contract Negotiation Leverage
Spend data converts vendor negotiations from a relationship conversation into a commercial one. When you walk into a renewal with consolidated spend data, utilization reports, and benchmark pricing, vendors engage on terms — not on switching-cost inertia.
Effective Negotiation Levers for Technology Contracts
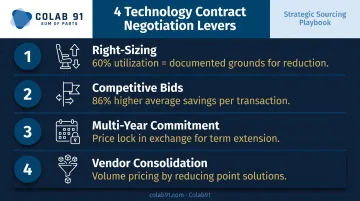
- If a team uses 60% of licensed seats, that's documented grounds for right-sizing — not a request, an evidence-based proposal based on actual usage vs. contracted volume
- Even naming a competitor shifts the conversation. Vendr's data shows buyers using competitive bids captured savings on 20% more deals and increased average savings by 86% per transaction
- Offering a multi-year commitment in exchange for a price lock or meaningful discount — if the vendor relationship warrants it
- Consolidating multiple point solutions with one vendor for volume pricing, reducing both vendor count and per-unit cost
Handling Auto-Renewal Clauses
Many technology contracts include auto-renewal terms with 30-to-90-day notice periods. Missing the notice window eliminates negotiation leverage entirely — the contract renews on existing terms and the next opportunity is 12 months away.
The fix is structural: a renewal calendar with assigned contract owners and automated alerts closes the gap before it opens. For organizations managing large contract portfolios — where tracking dozens of notice windows is operationally intensive — a dedicated offshore procurement analytics team monitoring renewals continuously is a more reliable backstop than relying on internal calendar management alone.
The PE Context: Technology Spend as EBITDA Lever
PE-backed organizations face compressed timelines for value creation. Technology spend reviews are a standard part of the first 100 days post-acquisition. Typical priorities include:
- Identifying contracts inherited from the prior management team
- Rationalizing duplicate tools acquired through add-ons
- Renegotiating legacy or above-market contract rates
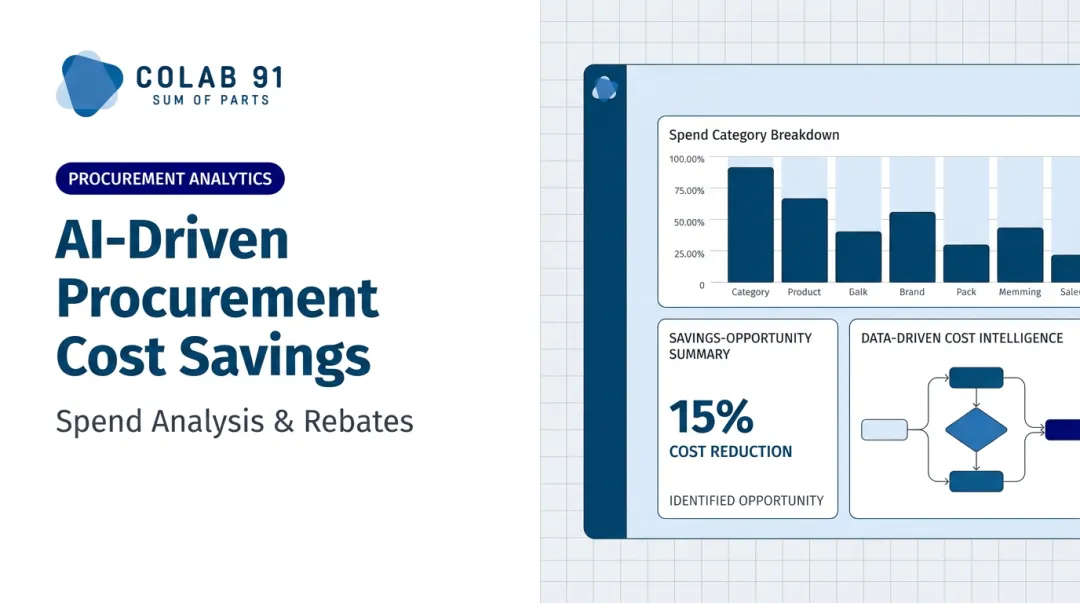
A structured spend analysis followed by a coordinated renegotiation program is a direct EBITDA lever. Colab91's Savings Opportunity Assessment and Procurement Diagnostic is built for this use case — quantifying actionable savings across direct and indirect spend, including technology, within four to six weeks. Typical findings identify 5–15% of addressable spend as savings opportunities.
Common Mistakes That Undermine Spend Analysis Efforts
Structural Mistakes
- Treating it as a one-time project. Data goes stale within months. Renewals catch teams off-guard again, and the cycle repeats. Spend analysis only generates sustained value when it runs continuously.
- Missing shadow IT. When lines of business control 70% of SaaS spend and procurement doesn't see it, the spend baseline covers less than a third of actual technology investment — and most savings opportunities disappear with it.
- No contract owner assignments. Analysis without accountability produces reports, not results. If no one owns the findings, auto-renewals proceed by default.
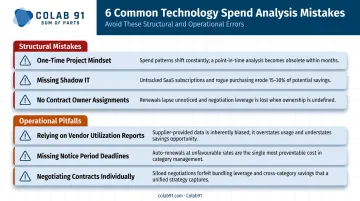
Operational Pitfalls
- Over-relying on vendor-provided utilization reports. Vendors have a commercial interest in showing high usage. Independent tracking through IT asset management or a third-party platform gives a more accurate — and more useful — picture.
- Not documenting notice periods before auto-renewals trigger. This is the most common and most avoidable mistake. A renewal calendar that tracks notice deadlines alongside expiry dates closes this gap entirely.
- Negotiating one contract at a time with the same vendor. Batching renewals across multiple products or agreements with the same vendor creates volume leverage that individual renegotiations can't access.
Each of these mistakes is fixable with process — a renewal calendar, clear ownership assignments, and independent usage tracking cost nothing to implement and close the gaps that quietly drain technology budgets.
Frequently Asked Questions
What is vendor spend analysis?
Vendor spend analysis is the process of collecting, categorizing, and analyzing how much an organization spends with each supplier, what it receives in return, and where inefficiencies exist. It surfaces duplicate vendors, unused contracts, and above-market pricing across the full supplier portfolio.
How do I keep track of vendor contract renewals?
Build a centralized contract register with renewal dates, notice periods, and assigned contract owners. Set automated alerts at 90, 60, and 30 days before each expiry. Without these, organizations default to auto-renewals on vendor-favorable terms.
What does a vendor analyst do?
A vendor analyst collects and analyzes spend data across the vendor portfolio, benchmarks pricing, tracks contract compliance and utilization, and supports negotiation preparation. In practice, they generate the data and analysis that sourcing and procurement teams need to negotiate from a position of strength.
How far in advance should you prepare for a technology contract renewal?
Strategic technology contracts require at least 90 days of preparation. High-value or complex agreements (enterprise licenses, cloud commitments) need six months. Starting negotiations close to renewal hands leverage to the vendor.
What data do you need before renegotiating a technology vendor contract?
Four inputs are essential: actual usage vs. contracted volume, benchmark pricing for comparable organizations, a history of price increases and contractual terms, and documented alternatives or competing vendor options.
How can mid-market companies build a technology spend analysis capability?
The most practical path combines spend analytics tooling with dedicated procurement resources. Offshore capability center models, like those Colab91 builds for mid-market and PE-backed clients, deliver domain-expert analysts at a fraction of full in-house costs — with continuous intelligence rather than periodic snapshots.