The problem isn't data volume. It's the absence of a structured, actionable procurement analytics dashboard — one that consolidates the right metrics, updates in real time, and tells decision-makers something they can act on.
This guide covers what a procurement analytics dashboard actually is (and how it differs from a report), which KPIs matter most, what benchmarks separate strong performers from average ones, and the design principles that determine whether a dashboard gets used daily or ignored entirely.
Key Takeaways
- A procurement analytics dashboard consolidates spend, supplier, compliance, and cycle time data into a single real-time view — enabling proactive decisions instead of reactive reporting.
- The most impactful KPIs span four domains: spend visibility, process efficiency, supplier performance, and financial compliance.
- Most dashboards fail because of fragmented data sources, poorly defined metrics, and one-size-fits-all design — not because of the tool chosen.
- Mid-market and PE-backed companies close the analytics gap with domain expertise and the right data infrastructure, not headcount alone.
What Is a Procurement Analytics Dashboard (and Why It's Not Just a Report)
A procurement analytics dashboard is a centralized, visual tool that pulls data from ERP systems, procure-to-pay platforms, supplier management tools, and contract repositories to display real-time KPIs across the full Source-to-Pay process.
The critical distinction: dashboards update continuously and surface anomalies as they emerge. A static report tells you what happened. A dashboard tells you what's happening, and catches problems before they compound.
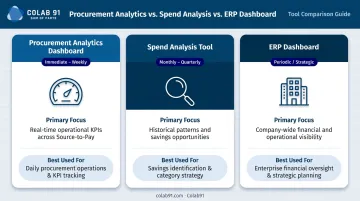
Dashboard vs. Spend Analysis Tool vs. ERP Dashboard
These three tools get conflated constantly, but they serve different purposes:
| Tool | Primary Focus | Decision Horizon |
|---|---|---|
| Procurement Analytics Dashboard | Real-time operational KPIs across Source-to-Pay | Immediate to weekly |
| Spend Analysis Tool | Historical patterns, savings opportunity identification | Monthly to quarterly |
| ERP Dashboard | Company-wide financial and operational visibility | Periodic / strategic |
Each serves a legitimate purpose. Use a procurement dashboard for operational visibility, a spend analysis tool for strategic sourcing decisions, and the ERP dashboard for executive financial rollups.
Who Uses Procurement Dashboards
- CPOs and procurement directors — strategic oversight, savings delivery, governance
- Category managers — supplier scorecards, contract utilization, category spend trends
- Finance teams — spend compliance, budget tracking, PO-backed invoice rates
- PE sponsors and executives — portfolio-level performance, EBITDA linkage, risk signals
Colab91's procurement analytics programs are structured around this stakeholder breakdown, delivering weekly and monthly intelligence packages, board-ready summaries, and category-level deep dives tailored to each audience — not a single report pushed to everyone.
Essential KPIs Every Procurement Dashboard Should Track
The goal isn't to track everything — it's to track the metrics that reflect procurement's strategic influence. Four KPI domains cover the terrain that matters most.
Spend Visibility KPIs
Spend Under Management (SUM) measures the percentage of total organizational spend actively governed by procurement. High coverage signals strategic reach; low coverage typically means maverick spend, missed savings, and limited supplier leverage.
SUM is a direct measure of procurement's influence. A function managing 40% of spend is stuck in reactive mode; one managing 85%+ has earned a seat at the strategy table.
Cost Savings Rate has two components that must be reported separately:
- Hard savings — negotiated price reductions that reduce actual cash outflow
- Cost avoidance — preventing spend increases (price holds, avoided contract escalations)
Conflating the two creates friction with finance. CFOs and PE sponsors count hard savings against the P&L. Cost avoidance rarely appears in EBITDA calculations. Reporting both, clearly labeled, eliminates the credibility gap.
Process Efficiency KPIs
PO Cycle Time measures average time from requisition creation to PO approval. Long cycle times signal manual bottlenecks, excessive approval layers, or disconnected systems — and the drag compounds across thousands of transactions annually.
Contract Compliance Rate and On-Contract Spend work together to reveal governance maturity:
- Contract compliance rate — percentage of purchases following approved procurement policies
- On-contract spend — percentage of spend directed to pre-negotiated supplier agreements
Together, these show how much of the value procurement negotiated is actually being captured versus leaking through off-contract purchasing.
Supplier Performance KPIs
Three metrics form a supplier health baseline. On-time delivery tracks whether orders arrive as scheduled — APQC benchmarking puts the cross-industry median at 90.0%. Defect rate captures quality failures per defined unit. SLA adherence measures whether service contracts are meeting their defined terms.
When any of these slip, the downstream effects are immediate: production delays, inventory shortfalls, and cost overruns. Catching trends early — before a supplier misses the threshold — is exactly what a live dashboard is built to do.
Financial Compliance KPIs
Spend visibility and supplier performance tell you what's happening operationally. Financial compliance KPIs tell you whether the controls underneath it all are holding.
Preapproved Spend Rate measures the percentage of invoiced spend linked to an approved purchase order. When this number drops, it signals spend occurring outside established controls — raising the risk of paying for unauthorized commitments.
Electronic Invoice Processing Rate — the percentage of invoices processed electronically rather than via paper or manual entry. Top manufacturing performers process 92.4% of invoices electronically (Coupa benchmark data). Billentis research puts the cost savings from e-invoicing versus conventional paper processing at 60–80% in most cases.
Industry Benchmarks: What "Good" Actually Looks Like
Tracking a KPI in isolation tells you a trend. Comparing it against a benchmark tells you whether that trend is acceptable or a problem. Benchmarks vary by industry, company size, and maturity. Use them as directional targets, not hard rules.
Spend Under Management
Ardent Partners' 2025 CPO Rising report (surveying 326 procurement executives) shows a significant performance gap:
- Best-in-class: 91.7% of spend under management
- All others: 61.1%
That 30-point gap represents real, quantifiable leakage: missed savings, unmanaged supplier relationships, and spend the business can't see clearly.
PO Cycle Time
APQC's cross-industry benchmarking reports:
| Performance Tier | PO Cycle Time |
|---|---|
| Top performers | 1 day |
| Median | 2 days |
| Bottom performers | 5 days |
Automation is the primary driver of the gap between median and top-quartile performance. According to Hackett Group research, Digital World-Class procurement teams achieve 58% shorter requisition-to-PO cycle times compared to peers.
Cost Savings Rate
APQC's cross-industry data from 915 companies sets the baseline:
- Median achieved sourcing savings rate: 5.0% of spend
- Top manufacturing performers: 6.3% (Coupa benchmark)
- PE-backed companies: typically target 6%+, where savings flow directly into EBITDA improvement programs
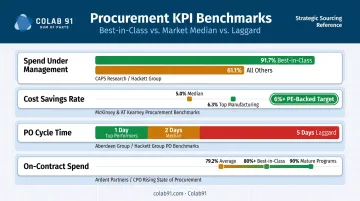
On-Contract Spend
ISM's reporting on Coupa benchmark data shows:
- Industry average (2022): 79.2%
- Best-in-class: 80%+
- Highly mature organizations: up to 90%
At 79.2% average compliance, roughly one in five dollars is spent outside negotiated contracts. That means pricing, terms, and supplier commitments your team worked to secure simply aren't being enforced at the point of purchase.
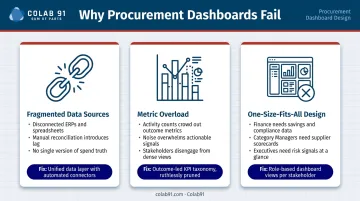
Why Most Procurement Dashboards Fail to Deliver Value
Understanding the failure modes is as important as knowing the best practices. Most dashboards don't fail because of the technology chosen — they fail for three predictable reasons.
Fragmented Data Sources
When dashboards are built on top of disconnected ERPs, spreadsheets, and departmental tools, teams spend more time reconciling conflicting numbers than acting on insights. A Globality/SCMR survey of 354 procurement professionals found that 80% of RFPs still run through manual emails and spreadsheets, and 96% report a lack of connection across teams.
By the time reconciled data reaches decision-makers, it's outdated — and finance loses trust in what procurement reports. Deloitte identifies data quality as one of the biggest internal barriers to procurement AI adoption and analytics effectiveness. This is a data infrastructure problem, not a technology one.
Metric Overload Without Strategic Focus
Most teams track activity counts when they should be tracking outcome metrics. A dashboard showing how many POs were raised is less valuable than one showing PO cycle time, on-contract spend, and cost savings rate. Fewer, more strategic metrics create clarity. Too many create noise — and dashboards that nobody opens.
One-Size-Fits-All Design
A dashboard built for no specific role goes unused by all of them. Each stakeholder needs something different:
- Finance — savings and compliance data tied to financial planning cycles
- Category managers — supplier scorecards and spend-by-category breakdowns
- Executives — risk signals, governance flags, and headline performance metrics
One undifferentiated view satisfies none of these needs — which is why role-based dashboard design is a prerequisite, not an afterthought.
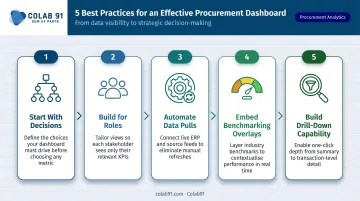
Best Practices for Building a Dashboard That Gets Used
Start With Decisions, Not Technology
The most common mistake is selecting a tool before defining what decisions the dashboard needs to support. Every KPI on the dashboard should map to a specific decision or action someone in the organization needs to take. Tool selection follows from that definition, not the reverse.
Build for Roles, Not Just Departments
Role-based views filter out noise for each user and surface only the metrics relevant to their decisions. In practice:
- CPO view: savings delivered vs. target, spend under management, supplier risk signals
- Category manager view: supplier performance, contract utilization, category spend trends
- CFO view: procurement KPIs tied to operating margins, working capital, and PO-backed invoice rates
Automate Data Pulls
Dashboards refreshed manually from spreadsheets have a credibility problem. The moment data is pulled, it starts aging. Automated integration with ERP, P2P, and supplier systems keeps KPIs current. For PE-backed companies in particular, where management reporting timelines are tight, stale data directly undermines portfolio-level decision-making.
Embed Benchmarking Overlays
KPIs without context are just numbers. Benchmarking overlays — whether internal (comparing business units or regions) or external (industry standards) — transform a KPI from a data point into a performance signal. Even a simple red/amber/green threshold system against benchmark targets significantly speeds up how quickly stakeholders interpret and act on what they see.
Build in Drill-Down Capability
Dashboards used for root cause analysis need more than high-level visuals. When a PO cycle time spikes, users need to trace it to a specific category, supplier, or approval bottleneck — without leaving the dashboard. That traceability is what separates a dashboard teams actually rely on from one they glance at and close. Drill-down capability is what makes it worth building in the first place.
Evolving Your Dashboard Into a Strategic Performance Engine
Connect Procurement KPIs to Finance Metrics
The bridges that make procurement dashboards relevant to CFOs are specific:
- PO cycle time and payment terms affect working capital efficiency
- Realized savings connect directly to operating margins
- Contract compliance reduces COGS exposure from off-contract purchasing
Procurement dashboards that surface these correlations stop being "procurement reports" and become enterprise performance tools that CFOs and PE sponsors actively rely on. Building this capability — whether through internal analysts or a dedicated offshore procurement analytics team like those Colab91 builds for mid-market and PE-backed companies — gives procurement a direct line into financial planning conversations.
That financial visibility also sets the foundation for the next layer of dashboard maturity: forward-looking risk and ESG signals.
Embed ESG and Risk Indicators
Modern procurement dashboards now incorporate forward-looking signals:
- Supplier financial health scores
- Operational resilience indicators
- Carbon intensity by spend category
- Spend with diverse suppliers
- Geographic and concentration risk
According to the CIPS/GEP Global State of Procurement and Supply 2024 survey, 78% of enterprises are committed to ESG issues and 49% of procurement leaders aim to improve sustainability performance. These signals shift procurement from documenting what happened to anticipating what could go wrong — enabling course corrections before disruptions occur rather than after.
Frequently Asked Questions
What KPIs should be on every procurement analytics dashboard?
Cover the four core domains: spend visibility (spend under management, cost savings rate), process efficiency (PO cycle time, on-contract spend), supplier performance (on-time delivery, SLA adherence), and financial compliance (preapproved spend rate, e-invoice processing rate). Start with one or two metrics per domain and expand as your data infrastructure matures.
What is the difference between a procurement dashboard and a spend analysis tool?
A procurement dashboard monitors real-time operational KPIs across the Source-to-Pay process — built for ongoing decision-making. A spend analysis tool is designed for historical deep dives to identify savings opportunities and sourcing strategies. They serve different time horizons, and most organizations need both.
What are typical industry benchmarks for procurement KPIs?
The most commonly benchmarked KPIs are spend under management (best-in-class: 91.7% per Ardent Partners), PO cycle time (top performers: 1 day per APQC), and on-contract spend (best-in-class: 80%+ per ISM/Coupa). APQC and Hackett Group publish the most reliable cross-industry benchmarks, though thresholds vary by sector and company size.
How often should procurement dashboards be updated?
Best-practice dashboards update in real time or near-real time via automated data feeds from ERP and P2P systems. Manual or periodic refreshes (weekly, monthly) are acceptable for strategic reporting but create operational blind spots — particularly for supplier performance and PO cycle time monitoring.
What data sources feed a procurement analytics dashboard?
Core internal sources include ERP systems, procure-to-pay platforms, contract repositories, and supplier relationship management tools. External sources — market intelligence platforms, supplier financial databases, ESG scoring providers — add context that internal data alone cannot provide, particularly for risk and benchmarking overlays.
How can mid-market companies build procurement analytics capability without large dedicated teams?
Mid-market companies can close the analytics gap through modern S2P platforms, pre-built dashboard templates, and domain-expert analytics teams — via consulting engagements or offshore capability centers. Colab91, for example, builds dedicated India-based procurement analytics teams that deliver continuous intelligence at substantially lower cost than onshore equivalents, with engagements designed to start small and scale as analytics maturity grows.