Introduction
Procurement reports $10M in savings. Finance sees $6M on the P&L. Leadership wants to know where the other $4M went.
This gap is one of the most persistent credibility problems in procurement - and it rarely comes from dishonesty. It comes from misaligned definitions, inconsistent baselines, and savings that were counted at contract signature rather than validated against what was actually paid.
According to the Hackett Group, measuring realized savings requires technology, process expertise, and close collaboration with finance. Without all three, procurement and finance will continue to work from different numbers.
This guide covers:
- What procurement savings tracking actually is and why definitions matter
- The types of savings that must be tracked and how each is measured
- A four-stage framework for managing savings from identification to validation
- The factors that most commonly cause savings to disappear between the pipeline and the P&L
Key Takeaways
- Savings tracking is a lifecycle process: definition, baseline-setting, execution, and finance-validated realization
- Three types of savings require different measurement approaches: hard savings, soft savings, and cost avoidance
- Per Ardent Partners, every non-compliant dollar costs 12–18% more - contract compliance is a savings tracking issue, not a separate initiative
- Shared definitions between procurement and finance must be locked in before any tracking system produces credible results
- For mid-market and PE-backed companies, a savings tracking function built on consistent methodology is a direct lever for EBITDA improvement
What Is Procurement Savings Tracking?
Procurement savings tracking is the systematic process of monitoring cost reductions generated through strategic sourcing, supplier negotiations, and cost-reduction initiatives - and confirming that those reductions actually appear in what the organization pays.
Three Layers, Not One
Most organizations track only one layer and wonder why the numbers don't hold up. There are three distinct layers:
- Forecasted savings - projected from initiatives that are planned or underway but not yet complete
- Realized savings - confirmed against actual spend and invoice data after execution
- Cost avoidance - spend that never materialized due to proactive procurement action
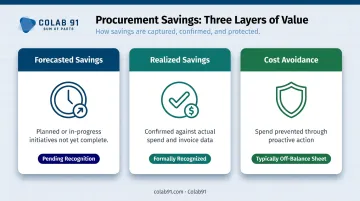
Finance typically recognizes realized savings and may exclude the others from official reports entirely. Tracking all three - with clear labels - is what separates procurement teams that are trusted from those that are perpetually questioned.
Savings Tracking vs. Spend Analysis
Procurement teams regularly mix these up - which leads to reporting gaps:
| Function | Purpose |
|---|---|
| Spend analysis | Identifies where money is being spent; surfaces opportunities |
| Savings tracking | Manages those opportunities through execution; validates whether savings hit the P&L |
Spend analysis surfaces the opportunity. Savings tracking confirms it hits the P&L.
Types of Procurement Savings You Need to Track
Not all savings speak the same language. Organizations that treat hard savings, soft savings, and cost avoidance as interchangeable create the exact ambiguity that finance rejects. Each type needs its own definition, measurement method, and sign-off process.
Hard Savings (Cost Reduction)
Hard savings are direct, measurable reductions in what the organization pays. Finance accepts them without debate because they show up directly on financial statements.
How to calculate them:
(Prior price or baseline price − New negotiated price) × Actual purchase volume = Hard savings
Examples include negotiated price reductions, supplier consolidation, and volume-driven discounts. ISM reports average cost savings of 3.1% of managed spend - a useful internal benchmark for assessing whether a category program is delivering at or above market.
Soft Savings
Soft savings improve process, risk posture, or operational efficiency without always reducing a specific budget line. Common examples:
- Reduced maverick spend through better supplier onboarding
- Faster sourcing cycle times that free up procurement capacity
- Avoided legal exposure through stronger contract terms
- Improved payment terms that benefit working capital
Finance needs a specific, quantified outcome - not a narrative. "Better contracts" isn't a saving. "Reduced exposure to uncapped liability on X contract, quantified at $Y" is.
Cost Avoidance
Cost avoidance is the value of what was not spent. A supplier proposed a 12% price increase; procurement negotiated it to 3%. The difference is cost avoidance.
ISM reports average cost avoidance of 2.0% of managed spend - nearly as significant as hard savings, but far harder to defend. Defending it requires documenting the counterfactual: what would have happened without procurement's intervention? Without a clear, documented answer, finance will discount it or reject it entirely.
That defensibility challenge starts with baseline selection - and the right baseline depends on the category.
Savings Calculation Approaches
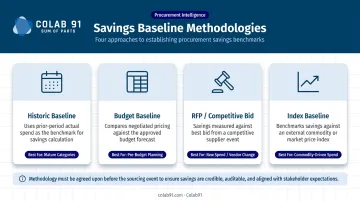
Different categories often require different baseline methodologies:
| Methodology | How It Works | Best Used When |
|---|---|---|
| Historic baseline | New price vs. prior-year price | Recurring spend with stable volumes |
| Budget baseline | Actual spend vs. budgeted spend | Internal cost center management |
| RFP / competitive bid | Awarded price vs. competing bids | Multi-supplier sourcing events |
| Index baseline | Price performance vs. commodity index | Raw materials, energy, freight |
Choosing the wrong methodology for a category is one of the fastest ways to produce savings figures that finance won't recognize. For a commodity category, using a historic baseline instead of an index baseline can inflate or mask performance entirely - agree on the right method before the sourcing event, not after.
How Procurement Savings Tracking Works: A 4-Stage Framework
Savings tracking is a managed pipeline: from idea to validated financial impact. High-performing procurement functions don't generate savings reports after the fact; they manage savings toward realization in real time.
Stage 1: Establish Shared Definitions and Categories
Before any tracking begins, procurement and finance must agree on:
- What qualifies as each type of saving (hard, soft, avoidance)
- Who can claim it and over what time period
- How each type will be measured and what baseline methodology applies
- What evidence is required for finance sign-off
Without this alignment, even accurate data will be disputed. The output of this stage should be standardized savings definitions embedded in business case templates and savings intake forms - not a verbal agreement that each team reinterprets each quarter.
Stage 2: Establish Baselines and Quantify Opportunities
Every savings initiative requires a defensible baseline. A prior contract price, a budget figure, a market index benchmark: whatever fits the category. The baseline is the denominator against which every savings claim is calculated. Set it wrong, and every figure built on top of it fails under scrutiny.
Spend analysis is the foundation here. Clean, categorized spend data surfaces where the largest opportunities exist and provides the historical pricing data needed to set credible baselines. If that data is wrong or incomplete, the baselines will be too.
Stage 3: Track Initiatives Through Execution
Most organizations lose savings here. Opportunities are identified and sized in Stage 2, then handed off to sourcing teams with no structured mechanism to track what happens next. A defined initiative lifecycle closes that gap:
- Identified - Opportunity scoped, baseline set, owner assigned
- Approved - Business case reviewed and signed off
- In Sourcing - RFP or negotiation underway
- Contracted - New pricing agreed and contract executed
- Realized - New pricing reflected in purchase orders
- Validated - Savings confirmed against actual invoice data
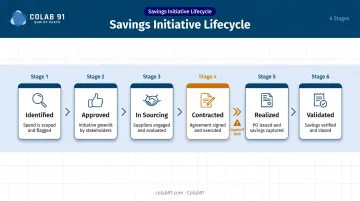
Each stage requires an assigned owner and a defined milestone. Cross-functional handoffs (particularly between procurement and accounts payable at the Contracted-to-Realized transition) are where savings most commonly stall.
Stage 4: Validate Against Actual Spend and Report to Finance
Contracted savings and realized savings are not the same thing. Validation means checking that negotiated prices actually appear on invoices, not assuming contract execution alone captures the savings.
Best practices for this stage:
- Reconcile savings claims against invoice and payment data, not just contract records
- Align reporting with finance's cadence (typically quarterly, tied to budget cycles)
- Use agreed classifications (hard, soft, avoidance) in every report
- Produce reports finance can audit independently, without requesting supplementary data
Key Factors That Affect Procurement Savings Tracking Accuracy
A clear framework is necessary but not sufficient. Several operational factors determine whether a savings tracking process produces numbers that are credible and decision-ready.
Baseline Quality
The single biggest determinant of savings credibility. Static, manually maintained baselines distort figures when they fail to account for:
- Volume changes between periods
- Currency movements on cross-border spend
- Commodity price shifts in raw material categories
This is the primary reason procurement and finance end up with different numbers - not fraud or spin, just different denominators.
Contract Compliance and Savings Leakage
Savings negotiated in a sourcing event can disappear fast if those rates never make it onto actual purchase orders. WorldCC reports that organizations lose an average of 11% of contract value after signing due to contracting lifecycle failures. Savings tracking must connect to transaction-level data to catch this.
Ardent Partners puts average contract-compliant spend at 65%, with every non-compliant dollar costing 12–18% more. Maverick spend - purchases made outside contracted suppliers - erodes realized savings without appearing anywhere in procurement reports.
Talent and Capacity
Rigorous savings tracking requires a specific mix of skills:
- Spend analysts who can work directly with transaction data
- Category managers who understand what drives cost in each category
- Professionals who can translate procurement outcomes into finance-ready reporting
This is frequently the binding constraint for mid-market companies. They often have the sourcing strategy in place but lack the analytical capacity to maintain baseline discipline, track initiatives through execution, and validate savings against invoice data consistently. Building a dedicated offshore procurement team - the model Colab91 uses with mid-market and PE-backed clients - is one practical path to establishing this function without the overhead of a full internal build.
Review Cadence
Organizations that review savings performance only quarterly often discover slippage too late to correct it. Monthly initiative reviews tied to sourcing milestones are a practical benchmark. Quarterly reporting to finance works for formal savings recognition; monthly internal reviews are what keep the pipeline on track.
Common Issues and Misconceptions in Procurement Savings Tracking
Tracking Is a Management Function, Not a Reporting Function
The most pervasive mistake is treating savings tracking as a periodic summary of what happened. Teams that produce a quarterly savings deck without actively managing initiatives between reports are not tracking savings - they are narrating outcomes after the fact.
The distinction matters: savings tracking is how procurement steers initiatives toward realization, not a documentation exercise that starts once the outcome is already set.
Why Spreadsheets Structurally Fail
Excel can handle a handful of initiatives. It cannot handle a serious savings tracking function. The structural problems:
- No integration with ERP or invoice data - savings exist in a separate document from the transactions they're supposed to reflect
- No version control - multiple people maintain separate copies with no audit trail
- No normalization for volume changes - a price reduction that looks like $500K may reflect lower volumes, not better pricing
- Manual entry errors accumulate quietly
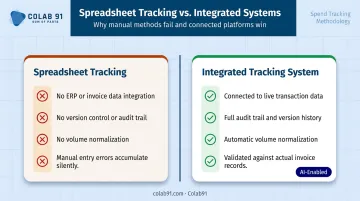
The Hackett Group's research ties Digital World Class procurement performance to 59% less savings loss from maverick buying and contract non-compliance. The gap isn't just process - it's whether the tracking function is connected to real transaction data.
Savings Identification vs. Savings Realization
Many organizations count savings when a sourcing event closes or a contract is signed. That is identification, not realization. Realization requires:
- New pricing implemented in the ERP or purchasing system
- Invoices from the supplier reflecting the contracted rate
- Actual spend data confirming the pricing is being applied
The "procurement reported $X, finance sees $Y" gap originates precisely here - procurement closes the initiative at contract signature, while finance measures what was actually paid. Connecting tracking to transaction-level data, not just contract records, is the only way to bridge that gap.
Frequently Asked Questions
How do you track procurement savings?
Tracking procurement savings requires a defined baseline (prior price, budget, or market benchmark), a classification for the type of saving being claimed, and an initiative workflow that runs from identification through execution. Critically, savings must be validated against actual invoice data - not just projected from contract terms.
How do you ensure cost savings in procurement?
Ensuring savings requires upfront alignment between procurement and finance on definitions and baselines, active initiative management through execution (not just planning), and contract compliance monitoring to catch off-contract spend. Regular variance reviews - comparing forecasted to realized savings - confirm whether commitments actually landed.
What is the difference between hard savings and soft savings in procurement?
Hard savings are direct, measurable reductions in spend that appear on financial statements, such as a negotiated price reduction. Soft savings improve process, risk, or efficiency without reducing a specific budget line. Each type needs its own measurement framework and finance sign-off criteria.
What is cost avoidance in procurement?
Cost avoidance is the prevention of a future cost that would otherwise have been incurred, such as negotiating away a supplier price increase or locking in rates before a renewal hike. Unlike hard savings, the spend never happens - so quantification depends on a documented baseline and a clear record of the supplier's original ask.
Why do expected savings often fail to materialize?
The most common causes: no active initiative tracking after the sourcing event, failure to verify that new pricing appears in actual invoices, maverick spend bypassing contracted suppliers, and missing finance alignment on what counts as a realized saving. Most organizations are dealing with more than one of these at once.
What are the most common mistakes in procurement savings tracking?
Counting savings at contract signature instead of invoice validation, using inconsistent baselines across categories, relying on spreadsheets disconnected from actual spend data, and skipping the finance alignment step at the start. All of these produce savings figures that procurement and finance perpetually dispute.