Introduction
MRO spend has a peculiar status in most organizations: everyone agrees it's operationally critical, yet it rarely gets the strategic attention it deserves. The paradox is stark - MRO materials represent only 5% of overall spending but account for up to 80% of procurement transactions, according to RS Integrated Supply. That's an enormous administrative burden attached to a category most procurement teams treat as background noise.
The practical consequences show up fast. Fragmented supplier bases, purchases made outside negotiated contracts, the same part recorded under five different descriptions across three systems. These aren't edge cases - they're the daily reality for most mid-market operations teams. Without a structured process for analyzing where MRO money actually goes, that fragmentation compounds silently until it shows up as budget overruns and unplanned downtime.
What follows breaks down what MRO spend analysis actually involves, why MRO is notoriously difficult to track, and what separates organizations that get it under control from those still flying blind.
Key Takeaways
- MRO spend covers the indirect materials and services that keep operations running (spare parts, consumables, PPE, tools) - not what goes into the finished product
- MRO spend analysis structures that expenditure - collecting, cleansing, and classifying it - so hidden costs become visible and actionable
- Decentralized buying, high transaction volume, and fragmented supplier bases create data blind spots that make MRO uniquely hard to manage
- Structured analysis enables cost reduction, supplier rationalization, maverick spend control, and risk mitigation
- Mid-market companies access enterprise-grade analytical rigor through offshore capability partners - no large in-house team required
What Is MRO Spend Analysis?
MRO spend analysis is the systematic process of gathering, cleansing, classifying, and analyzing expenditure data across maintenance, repair, and operations categories. The goal is clear visibility into what is being spent, with whom, and why.
MRO vs. Direct Spend - Why the Distinction Matters
Direct spend covers materials that become part of the finished product - raw materials, components, assemblies. MRO spend is everything else that keeps the operation running: replacement parts, lubricants, PPE, hand tools, facility supplies, and contractor maintenance services.
This distinction shapes procurement strategy. Direct materials are bought against known bills of materials on predictable schedules. MRO purchases are demand-driven, often urgent, and spread across hundreds of SKUs with no equivalent planning discipline. That's why standard direct procurement playbooks rarely translate well to MRO.
What MRO Spend Data Actually Looks Like
A typical MRO spend dataset draws from multiple sources:
- Purchase orders and supplier invoices
- ERP and CMMS records
- Purchasing card transactions
- Accounts payable files
- Site-level or department-level purchase logs
This data lives in separate systems, uses inconsistent item descriptions, and spans dozens of suppliers across multiple locations. Aggregating it into something analytically useful requires structured analytical work.
Why MRO Spend Is So Difficult to Track
The difficulty here isn't just a data systems problem. It's structural - built into how MRO purchasing actually works across organizations.
Decentralization and Transaction Volume
MRO purchasing tends to happen at the edges of the organization - individual sites, maintenance teams, and technicians making their own sourcing decisions. The RS/CIPS 2026 Indirect Procurement Report reports that organizations work with an average of 83 MRO suppliers. Many have hundreds. Each supplier relationship generates its own transaction stream, and those streams rarely flow into a single, consolidated view.
The Data Quality Problem
Even when those fragmented streams are captured, the data is rarely clean. The same spare part might appear as "bearing 6205," "SKF 6205," "Brg 6205 2RS," and an internal stock code - all referring to the same item across different systems. One RS Integrated Supply case study found that before intervention, only 28% of items had manufacturer names and 0% were linked to categories, despite more than 22,000 SKUs in inventory. That's not an outlier - it's what unmanaged MRO data looks like.
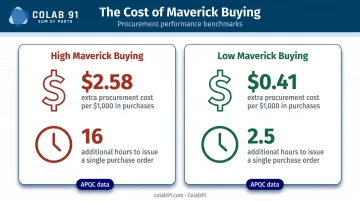
Maverick Buying Under Pressure
When a machine goes down, nobody waits for procurement approval. Technicians call the familiar local vendor, pay whatever the price is, and get operations back online. That urgency makes sense in the moment, but the cumulative cost is severe. Some procurement managers report over 50% of MRO purchases made off-contract.
APQC data puts a number on the damage for organizations with high maverick buying rates:
- $2.58 more in procurement cost per $1,000 in purchases vs. low-maverick peers
- 16 additional hours at the median just to issue a single purchase order
Key Reasons to Engage in MRO Spend Analysis
Cost Visibility and Savings Identification
The starting point for any savings program is knowing what you're actually spending. Spend analysis consolidates data from all sites and systems to answer basic questions: what are we buying, from whom, and at what price?
Common findings include:
- Price variances for identical items across different sites or suppliers
- Duplicate orders placed across locations unaware of each other's inventory
- Categories where volume consolidation could unlock meaningful discounts
The evidence for what's achievable is real. One global life sciences manufacturer, after data standardization, strategic sourcing, and procurement automation, achieved $2.16M in first-year MRO cost savings and 12.11% net savings across closed purchase orders.
Supplier Rationalization
Most organizations carry far more MRO suppliers than they need. The RS/CIPS 2026 data shows an average of 83 active MRO suppliers - many with only a handful of transactions per year. Managing each relationship consumes administrative time: order processing, invoice reconciliation, performance tracking.
The same RS benchmark reports that among organizations tracking order-processing costs, the average is £77 per order (approximately $97 USD at current rates). Multiply that across thousands of annual MRO transactions and the overhead becomes significant.
Spend analysis surfaces the full supplier landscape, making consolidation decisions data-driven rather than political. One RS Integrated Supply program reduced active suppliers from over 600 to 244 - a reduction that contributed to a 93% drop in monthly stockouts alongside the first-year savings figure above.
Maverick Spend and Contract Compliance Control
Analysis answers a question that matters to every procurement leader: what percentage of MRO spend actually flows through negotiated contracts?
When maverick buying hotspots are visible, root causes become addressable. The most common culprits:
- Catalog gaps - the contracted supplier doesn't stock a needed item
- Friction in the approval process that pushes buyers off-contract
- Site-level purchasing habits that predate any formal agreement
None of these is fixable without first knowing where the problem is concentrated.
Risk Identification
Spend analysis exposes supplier concentration risk that would otherwise stay invisible. A single supplier providing most of the critical spare parts for a production line is a business continuity risk - but you can only see it if your data is consolidated and classified.
Categories worth monitoring through spend analysis:
- Single-source dependencies on critical items
- Geographic concentration in the supply base
- Categories with high price volatility or thin supplier markets
Budget Predictability and Reduced Emergency Costs
When spend analysis connects to maintenance schedules and asset criticality data, reactive purchasing starts shifting toward planned procurement. According to Siemens' 2024 downtime research, unplanned outages cost the world's 500 largest companies approximately $1.4 trillion annually. Emergency parts orders carry expedited freight charges, spot pricing, and rush premiums that planned procurement avoids entirely.
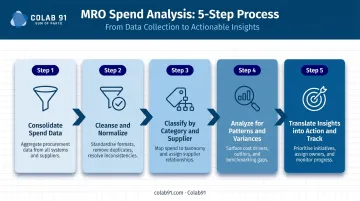
How MRO Spend Analysis Works: Step by Step
MRO spend analysis is not a one-time project. The harder challenge is building the data discipline and analytical capacity to run these steps consistently - cycle after cycle.
Step 1 - Consolidate Spend Data from All Sources
Pull expenditure from every relevant system: ERP, CMMS, accounts payable, purchasing cards, and supplier invoices across all sites and business units. The most common failure here is incomplete capture - leaving out local purchasing or credit card buys distorts everything downstream.
Step 2 - Cleanse and Normalize the Data
Standardize inconsistent item descriptions, supplier names, unit-of-measure discrepancies, and category codes so the same part or supplier is recognized consistently. This is the most labor-intensive step. AI-assisted normalization tools can compress what used to take weeks of manual work into days - and this is where dedicated analytics teams earn their keep fastest.
Common data quality issues to resolve at this stage:
- Duplicate supplier records under slightly different names
- Inconsistent unit-of-measure entries (each vs. box vs. case)
- Missing or miscoded category tags across sites
Step 3 - Classify Spend by Category, Supplier, and Site
Map cleansed data to a structured taxonomy - by commodity type (spare parts, consumables, PPE, contractor services) and segment by supplier, facility, and business unit. This is where the 80/20 pattern becomes visible: a small number of categories and suppliers account for the majority of spend and savings opportunity.
Step 4 - Analyze for Patterns, Variances, and Opportunities
Run the core analysis:
- Price variances for identical items across sites or suppliers
- Categories with high supplier fragmentation
- Quantified off-contract spend
- Savings potential ranked by category
This step transforms cleansed data into a prioritized opportunity map.
Step 5 - Translate Insights into Action and Track Results
Convert the opportunity map into sourcing actions: supplier consolidations, contract renegotiations, catalog updates, policy changes. Set measurable targets and track outcomes across subsequent cycles. Without that tracking loop, the same inefficiencies resurface in the next cycle - and the analysis investment goes to waste.
How Colab91 Can Help
Mid-market and PE-backed companies often recognize the value of MRO spend analysis but lack the in-house capacity to run it consistently. Building a dedicated analytics function from scratch is expensive; engaging a Big 4 firm for a one-off report is costly and doesn't leave behind ongoing capability.
Colab91 takes a different approach. The company builds dedicated offshore analytics and procurement support teams in India - combining domain expertise in strategic sourcing and spend analytics with cost-efficient delivery. Clients gain the structured, repeatable analysis associated with large enterprise procurement functions without the overhead of building and maintaining that capacity internally.
The team's track record is grounded in real program delivery. Colab91's leadership previously ran India operations for Impendi (acquired by Accenture), scaling a multifunctional analytics and sourcing organization to over 100 practitioners serving portfolio companies backed by Carlyle Group, TPG, and Elliott. That experience shaped the structured delivery model Colab91 brings to MRO spend programs today.

The engagement model is designed for continuity, not one-off reporting. Rather than delivering a single spend analysis and stepping back, Colab91 sets up ongoing capability - with teams responsible for:
- Owning the data pipeline and keeping spend classifications current
- Maintaining spend taxonomies as supplier and category landscapes shift
- Monitoring contract compliance against negotiated terms
- Surfacing new savings opportunities on a continuous basis
The result is a functioning analytical operation - not a report that sits on a shelf.
Conclusion
MRO spend is indirect in name only. Its impact on uptime, safety, and operational continuity is real - and so is the cost of managing it poorly. Without structured spend analysis, organizations accumulate fragmented supplier bases, leaking contracts, and emergency purchase premiums that compound over time.
That's what makes MRO spend analysis different from a one-time cost reduction exercise. It's a capability that builds on itself. Each cycle produces cleaner data, more actionable category intelligence, and higher savings capture than the last. The organizations that get the most from it are the ones that treat it as a standing function - not a response to a budget crisis.
Frequently Asked Questions
What does MRO spend mean?
MRO spend refers to all expenditure on Maintenance, Repair, and Operations items - the indirect materials and services that keep facilities and equipment running but don't become part of the finished product. Common examples include spare parts, lubricants, safety supplies, hand tools, and facility consumables.
What is the 80/20 rule in spend analysis?
The 80/20 rule (Pareto principle) holds that roughly 80% of total spend is concentrated with about 20% of suppliers or SKUs. In practice, this means procurement teams can capture the majority of savings opportunity by focusing analysis on a relatively small subset of categories and vendors.
What are the 5 stages of spend analysis?
Spend analysis moves through five stages: data collection, data cleansing and normalization, spend classification, opportunity identification, and action and tracking. Early data quality is decisive - it directly shapes the value of insights at every stage that follows.
Why is MRO spend harder to manage than direct spend?
Direct materials are bought in planned quantities against known bills of materials. MRO purchases, by contrast, are demand-driven, decentralized, and urgent - producing fragmented supplier bases, inconsistent data, and high maverick buying rates that structured analysis and clear policy can address.
What data sources are needed for MRO spend analysis?
Effective MRO spend analysis draws from purchase orders, invoices, supplier contracts, ERP and CMMS records, p-card data, and accounts payable files. Consolidating these sources across all sites and business units is what makes the picture complete.
How often should companies conduct MRO spend analysis?
A full spend analysis is typically conducted quarterly or annually, but leading organizations maintain a continuous data pipeline allowing real-time monitoring of key metrics. This keeps insights current and surfaces savings opportunities as they emerge.