Introduction
Many procurement leaders manage hundreds of millions in third-party spend without a reliable way to measure whether their sourcing strategy is actually working. Intuition alone and lagging indicators - a supplier complaint here, a budget overrun there - are poor substitutes for structured performance data.
Strategic sourcing KPIs solve this. They convert sourcing activity into quantifiable business outcomes: how much cost was saved, how reliable the supply base is, and whether sourcing processes are fast enough to support business agility.
The catch? Not all KPIs are worth tracking. The right set depends on your organization's maturity, spend profile, and near-term cost targets. A PE-backed company under a value creation mandate needs different leading indicators than a mature enterprise refining its category management program.
This article breaks down the three KPI categories that matter most, with practical guidance on which to prioritize first:
- Cost and spend performance - savings realized, spend under management, and price variance
- Supplier performance and risk - delivery reliability, quality metrics, and concentration exposure
- Operational efficiency - cycle times, contract compliance, and sourcing capacity utilization
Key Takeaways
- Strategic sourcing KPIs measure outcomes (cost saved, supplier reliability), not just activity (RFPs issued)
- The three non-negotiable categories: cost/spend KPIs, supplier performance KPIs, and operational efficiency KPIs
- Spend Under Management, Cost Reduction %, On-Time Delivery, and Contract Compliance Rate are the baseline for any sourcing function
- PE-backed companies should tie KPIs directly to EBITDA targets from day one
- Most mid-market companies underinvest in analytical capacity - and that's exactly where KPI tracking breaks down
Why Strategic Sourcing KPIs Matter (and Which Ones Don't)
Metrics vs. KPIs: A Necessary Distinction
A metric measures activity; a KPI measures outcome. The number of RFPs issued is a metric. The cost reduction achieved through those RFPs - that's the KPI.
Procurement teams rarely lack data. What they often lack is the right data - the kind that tells you whether the activity was worth doing, not just that it happened.
There are three clear reasons to invest in a disciplined KPI framework:
- Financial accountability - procurement needs to demonstrate its contribution to the bottom line, not just report on process activity
- Early warning signals - supplier or process failures show up in KPI trends before they become expensive problems
- Strategic alignment - KPIs connect sourcing decisions to enterprise priorities like cost reduction, risk mitigation, or supplier consolidation
The Pitfall of KPI Sprawl
Once the case for KPIs is clear, the next risk is overbuilding the framework. Tracking 20+ KPIs without prioritization produces dashboards that no one acts on. The Hackett Group warns that tactical metrics like purchase price reductions can mislead when they ignore total cost of ownership, supplier risk, and implementation quality.
Good KPI design means selecting a focused set tied directly to business decisions, then revisiting them as strategy evolves.
Cost Savings and Spend KPIs: The Foundation of Strategic Sourcing
Finance and leadership scrutinize these KPIs most closely. For PE-backed companies, they're often tied directly to deal thesis and EBITDA targets. According to McKinsey's research on digital procurement in private equity, a two- to three-week procurement diagnostic can identify savings targets equal to 10% to 20% of EBITDA.
Four KPIs form the core of any cost and spend measurement framework. Here's how each one works and what it tells you:
Cost Reduction Percentage (Hard Savings)
This measures the percentage reduction in costs achieved through sourcing initiatives - renegotiation, competitive bidding, supplier consolidation - against a prior-period baseline or should-cost model. It's the most direct measure of sourcing effectiveness.
According to Ardent Partners/CPO Rising, Best-in-Class procurement teams achieve savings rates of 8% versus 6.4% for all other organizations.
Spend Under Management (SUM)
SUM tracks the proportion of total organizational spend actively influenced by procurement - through contracts, preferred suppliers, or managed categories. Low SUM signals cost leakage, a common problem in mid-market companies without mature sourcing functions.
Every new dollar brought under procurement management typically yields 6% to 12% savings during the initial contract period.
Cost Avoidance
Cost avoidance captures spend that was prevented - stopping a supplier price increase through early renegotiation, for example. It's soft value rather than hard savings, but it demonstrates procurement's foresight and proactive supplier management.
Deloitte's 2025 CPO survey found 94% of high-performing procurement leaders met cost avoidance targets, versus 75% of their lower-performing peers.
Purchase Price Variance (PPV) and Total Cost of Ownership (TCO)
PPV measures the difference between budgeted and actual price paid - a short-term indicator of whether negotiated savings are holding in practice. TCO captures the full lifecycle cost: acquisition, usage, maintenance, and disposal.
Together they tell a complete story. PPV shows pricing discipline; TCO shows long-term sourcing value.
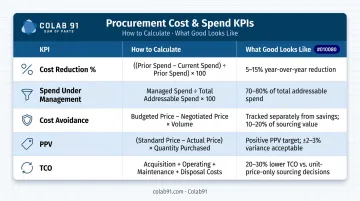
Cost and Spend KPI Summary
| KPI | How to Calculate | What Good Looks Like |
|---|---|---|
| Cost Reduction % | (Prior cost – Current cost) / Prior cost × 100 | Best-in-Class: ~8% savings rate |
| Spend Under Management | Managed spend / Total addressable spend × 100 | Best-in-Class: >90%; average: ~71% |
| Cost Avoidance | Estimated increase – Actual price paid | Track against plan; >90% attainment is leader benchmark |
| PPV | (Standard price – Actual price) × Units purchased | Negative variance (favorable) as a consistent trend |
| TCO | Acquisition + operating + maintenance + disposal costs | Lower TCO vs. alternatives; measured per category |
Supplier Performance and Risk KPIs
Supplier performance KPIs determine whether your supply base delivers on what was negotiated. For organizations with complex supply chains or single-source dependencies, these KPIs are also the first line of defense against disruption. Resilinc reported 22,522 supply chain disruption notifications in 2024 - a 38% year-over-year increase - underscoring why reactive supplier management is no longer viable.
The Four Core Supplier Performance KPIs
On-Time Delivery (OTD) Rate - Percentage of deliveries received on or before the agreed date. Missed deliveries delay production schedules, drive emergency spend, and damage customer SLAs. APQC notes that high OTD rates also reduce inventory carrying costs.
Supplier Defect Rate / Quality Performance - Frequency of quality failures or defective goods from a given supplier, measured in PPM or DPMO per ASQ methodology. Tracking defect rates enables objective supplier evaluation beyond price.
Supplier Lead Time - Total time between placing an order and receiving goods or services. Average lead time matters, but variance matters more. A supplier delivering in 12 days sometimes and 28 days other times creates more planning risk than one who consistently delivers in 18.
Supplier Risk Rating and Single-Source Concentration - A composite score covering financial health, geopolitical exposure, ESG compliance, and regulatory adherence. The number of sole-source suppliers is a critical sub-metric. Sole-source dependency can be catastrophic during disruption events - Resilinc noted companies actively reduced single-source exposure in 2024 through nearshoring and reshoring.
Supplier Performance KPI Summary
| KPI | How to Calculate | What Good Looks Like |
|---|---|---|
| On-Time Delivery Rate | On-time deliveries / Total deliveries × 100 | Track trend; higher is better; establish category-specific targets |
| Supplier Defect Rate | Defective units / Total units received × 1,000,000 (PPM) | Lower PPM over time; varies significantly by category |
| Supplier Lead Time | Average days from PO issuance to receipt | Track variance alongside average; tighter variance = better planning |
| Supplier Risk Rating | Composite score across financial, compliance, ESG, operational factors | No single benchmark; flag high-risk and sole-source suppliers for active management |
Operational Efficiency and Compliance KPIs
Operational KPIs reveal whether the sourcing process itself is working. Slow cycle times, low contract coverage, and poor data quality all erode the value of strategic sourcing - even when category strategies are sound.
Procurement Cycle Time
Total time from identifying a sourcing need to contract award or PO issuance - what APQC formally calls "cycle time to issue a purchase order in days." Long cycle times signal bottlenecks in approvals, stakeholder alignment, or supplier selection, and they delay time-to-savings capture. Tracking this metric drives organizational agility by creating pressure to remove process friction at each stage.
Contract Compliance Rate
The percentage of purchases made through negotiated contracts with approved suppliers. Low compliance - often called maverick spend - directly undermines sourcing savings. You can negotiate excellent rates, but if stakeholders buy off-contract, the value disappears. Ardent Partners data shows average contract-compliant spend sits at 65%, while Best-in-Class organizations achieve 85.6%. Maverick spend costs enterprises an additional 12% to 18% per dollar spent.
This KPI is particularly revealing in decentralized organizations where business units have purchasing autonomy without central oversight.
Spend Analysis Accuracy and E-Procurement Adoption
Both metrics point to the same underlying issue: most procurement functions are flying partially blind.
Spend analysis accuracy tracks whether spend data is correctly categorized and attributed. Without it, every downstream KPI becomes unreliable. PwC's 2022 Global Digital Procurement Survey found only 10% of respondents rated their procurement data quality as high.
E-procurement adoption measures what proportion of sourcing activity runs through digital or automated channels. PwC found average digitalization at just 41% - meaning the majority of procurement still runs on manual, error-prone processes that constrain both speed and analytical insight.
Operational Efficiency KPI Summary
| KPI | How to Calculate | What Good Looks Like |
|---|---|---|
| Procurement Cycle Time | Days from requisition to PO issuance or contract award | Benchmark using APQC data; track trend toward reduction |
| Contract Compliance Rate | Contract-compliant spend / Total spend × 100 | Best-in-Class: ~85.6%; average: ~65% |
| Spend Analysis Accuracy | % of spend correctly classified by category and supplier | >95% classification accuracy as a working target |
| E-Procurement Adoption | Transactions via e-procurement / Total transactions × 100 | Best-in-Class supplier e-enablement: ~54% (vs. average ~38%) |
How to Prioritize the Right KPIs for Your Organization
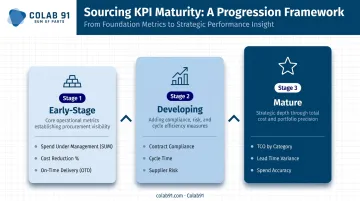
Start With Your Maturity Level
KPI selection should reflect where your organization actually is - not where a generic benchmark says it should be.
- Early-stage sourcing function: Start with 3–5 foundational KPIs: Spend Under Management, Cost Reduction Percentage, and On-Time Delivery Rate. These establish baselines and demonstrate value quickly.
- Developing function: Add Contract Compliance Rate, Procurement Cycle Time, and Supplier Risk Ratings once foundational tracking is in place.
- Mature function: Layer in leading indicators like TCO by category, lead time variance, and spend analysis accuracy for continuous improvement.
Start with KPIs tied to your biggest pain points or value creation goals - a focused list of five beats an ignored list of twenty.
The PE-Backed and Mid-Market Context
Under a value creation mandate, sourcing KPIs need to connect directly to EBITDA targets - not just operational benchmarks. This means:
- Set baselines immediately - many mid-market companies lack spend transparency because fragmented data makes baseline-setting genuinely difficult. A credible spend baseline is usually the first critical step.
- Prioritize cost and spend KPIs first. Cost Reduction Percentage and Spend Under Management belong at the top, with targets tied directly to the holding period value creation plan.
- Track savings realization, not just identification. Identified savings that don't make it to the income statement don't count.
The Analytical Capacity Gap
Consistent KPI tracking requires dedicated capacity to collect, cleanse, and analyze sourcing data on an ongoing basis. This is where most mid-market companies underinvest - the data doesn't cleanse itself, and category-level analysis doesn't happen without people who understand both the numbers and the sourcing context.
Colab91 builds dedicated offshore sourcing and analytics teams for PE-backed and mid-market companies, providing continuous KPI monitoring and reporting that frees up lean in-house procurement teams to focus on higher-value work. The team's background includes building and scaling India-based delivery centers serving major PE sponsors like Carlyle Group and TPG, with deep expertise in spend analytics and sourcing performance tracking.
Conclusion
Strategic sourcing KPIs are not a static checklist. They're a decision-making tool that should evolve as your organization's sourcing maturity, supply base, and strategic priorities change. The goal is never more metrics - it's the right metrics, consistently acted on.
Moving from reactive sourcing to genuinely strategic procurement requires both a sound KPI framework and the analytical capacity to act on the data. Most mid-market organizations have neither fully in place.
Colab91 works with mid-market and PE-backed companies to build dedicated India-based sourcing and analytics teams that fill this gap - turning KPI data into concrete savings and measurable supply chain performance improvements.
Frequently Asked Questions
What are the key performance indicators for strategic sourcing?
The core KPI categories are cost savings and spend management (Cost Reduction Percentage, Spend Under Management), supplier performance (On-Time Delivery, Defect Rate), and operational efficiency (Cycle Time, Contract Compliance Rate). The right mix depends on your organization's goals and current maturity level.
What are the 5 P's of sourcing?
Various practitioners use different versions of this framework - common variants include Product, Price, Place, Promotion, and Process, or sourcing-specific adaptations. There's no universally standardized version across major procurement bodies. KPIs function as the measurement layer applied on top of whichever variant your organization adopts.
How is strategic sourcing different from tactical procurement?
Tactical procurement fulfills immediate purchase needs. Strategic sourcing takes a longer-term, data-driven approach to supplier selection, total cost optimization, and supply base management. Tactically, metrics measure individual transactions; strategically, KPIs track outcomes and trends over time.
How often should strategic sourcing KPIs be reviewed?
Operational KPIs - cycle time, on-time delivery - should be reviewed monthly. Strategic KPIs - cost savings, spend under management - warrant quarterly tracking with an annual baseline refresh. Without consistent cadences, KPIs rarely translate into meaningful action - irregular review is one of the most common reasons they fail to drive improvement.
What sourcing KPIs matter most for PE-backed companies?
Cost Reduction Percentage, Spend Under Management, and Contract Compliance Rate are the most critical for PE-backed companies. These connect directly to EBITDA improvement and can be tied to specific value creation milestones across the holding period.