Introduction
Procurement leaders at mid-market and PE-backed companies are caught in a familiar bind: boards demanding cost savings, CFOs wanting spend visibility, and supplier risks rising—all while teams stay lean and data sits scattered across systems.
The problem isn't effort. It's reference points. Without reliable benchmarks, procurement operates on instinct rather than market reality.
You can't know whether a 3-day PO cycle time is world-class or embarrassingly slow, or whether your 68% spend under management is competitive or leaving millions on the table.
Benchmarks give you those reference points. This guide covers procurement benchmarking end-to-end: what it is, which KPIs actually matter, how to run the process across five practical steps, and how to convert gap findings into measurable improvements in cost, speed, and supplier performance.
Key Takeaways
- Procurement benchmarking measures your cost, speed, and supplier KPIs against external peer standards to identify performance gaps
- The highest-impact KPIs include cost savings rate, PO cycle time, spend under management, contract compliance, and supplier on-time delivery
- Most benchmarking programs fail on data quality, not on strategy or intent
- Continuous monitoring beats annual benchmarking cycles for catching deviations early
- Mid-market and PE-backed companies can unlock meaningful EBITDA gains by closing procurement performance gaps through structured benchmarking
What Is Procurement Benchmarking and Why It Matters
Procurement benchmarking measures a company's procurement performance — cost, speed, compliance, and supplier quality — against external industry standards, peer organizations, or top performers. The goal is straightforward: identify where gaps exist and set targets that are grounded in reality, not internal guesswork.
The Hackett Group defines it as measuring sourcing and procurement performance against external peers, including industry leaders and best-in-class companies, across metrics like cost savings, supplier performance, cycle times, contract compliance, and technology adoption.
Internal KPIs vs. External Benchmarks
The distinction between the two is straightforward, but the implications are significant:
- Internal KPIs track performance over time within your organization. They confirm whether performance is trending in the right direction.
- External benchmarks tell you whether that improvement is enough. They show where you stand relative to competitors, not just relative to your own past.
For PE sponsors and boards, the second question is the one that actually matters. Internal improvement without external context can mask serious competitive gaps.
Three Types of Benchmarks
| Type | What It Measures | Best Used For |
|---|---|---|
| Internal | Your own historical performance | Trend tracking, continuous improvement |
| Industry | Peer organizations in your sector | Competitive positioning, investment justification |
| Best-in-class | Top performers globally, regardless of industry | Setting aspirational targets |
Most mature programs use all three together. Industry benchmarks are typically the right starting point — they align directly with how PE sponsors and boards frame competitive position, making findings easier to act on and easier to defend.
Key Procurement KPIs and Benchmarks to Track
Selecting the right metrics determines whether benchmarking drives decisions or just generates reports. Too many teams track activity-based metrics — number of suppliers, number of sourcing events — rather than outcome-based ones. Activity metrics look busy. The metrics below show whether you're actually competitive.
Cost Savings as a Percentage of Addressable Spend
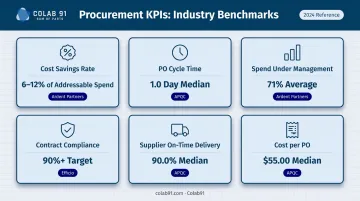
This is the headline metric for most boards and PE sponsors. According to Ardent Partners' CPO Rising research, every additional dollar of spend brought under procurement management yields 6% to 12% savings during the initial contract period.
Track this by category, not as a single blended number. A blended rate obscures which categories are performing and which are dragging down the average.
PO Cycle Time (Requisition to PO Approval)
APQC's benchmark data across 1,145+ companies shows a median PO cycle time of 1.0 day for services procurement. Hackett Group reports Digital World Class procurement teams run requisition-to-PO cycles 58% faster than average peers.
Faster cycle times matter beyond process efficiency. They reduce operational friction and lower the risk of stakeholders bypassing procurement controls entirely — which directly inflates maverick spend.
Spend Under Management
Ardent Partners reports that procurement teams manage an average of 71% of total enterprise spend in 2025. For PE portfolio companies under value creation pressure, closing the gap from below-average to that 71%+ threshold is often the single highest-leverage move available.
Unmanaged spend is invisible spend: pricing, terms, and supplier quality all operate without oversight — and without the data to course-correct.
Contract Compliance Rate
Low compliance rates directly erode negotiated savings. Hackett Group data shows Digital World Class procurement teams lose 60% less potential savings by reducing maverick buying and contract non-compliance compared to average peers.
The target to aim for: Efficio's PE portfolio-company benchmarks cite 90%+ purchase order compliance as a standard for high-performing procurement functions.
Supplier On-Time Delivery Rate
APQC's benchmark across 4,648+ companies sets the median supplier on-time delivery rate at 90.0%. Track this alongside cost metrics — poor supplier delivery generates hidden costs (expediting, production delays, customer impact) that can easily offset procurement savings.
Two Additional Metrics Worth Tracking
- Procurement cost as a percentage of revenue: APQC's benchmark shows a median of $4.57 per $1,000 revenue (roughly 0.46%), a useful process efficiency indicator
- Cost per purchase order: APQC median is $55.00 per PO across 4,622 companies, the primary indicator of automation impact
How Procurement Benchmarking Works – Step by Step
This process is designed for lean teams—whether running procurement in-house or augmenting with external expertise. Five stages, each with a clear output.
Step 1 – Define Objectives and KPIs
Start with the business question, not the metrics. Is this benchmarking effort about:
- Demonstrating cost savings to a PE sponsor before a value creation review?
- Identifying supplier rationalization opportunities?
- Building the case for procurement technology investment?
The objective determines which KPIs are worth tracking. Tie every selected KPI directly to a business outcome—EBITDA improvement, working capital optimization, risk reduction—before data collection starts. The output of this step is a signed-off KPI list with explicit business rationale—leadership alignment before the first data pull.
Step 2 – Centralize and Normalize Your Data
Benchmarking is only as reliable as the data feeding it. Three common blockers prevent accurate comparisons:
- Fragmented ERP systems with no consolidated spend view
- Manual spreadsheets with inconsistent category labels
- Spend classifications that vary by business unit or region
The goal: a single, clean source of truth with spend classified to a consistent taxonomy (UNSPSC or client-specific).
Most mid-market organizations lack the dedicated analytics resources to cleanse and categorize spend data at scale. Colab91's India-based procurement analytics teams handle this as a managed workstream—spend cleansing, taxonomy classification, and enrichment with supplier risk and contract-terms data—compressing what typically takes two to three quarters into weeks.
Step 3 – Select Peer Benchmarks and Set Baselines
Trusted external benchmark sources include:
- APQC – Open Standards Benchmarking, procurement key measures
- Hackett Group – procurement benchmarking using 57,700+ metrics
- Gartner – Procurement Budget & Efficiency Benchmark (peer-based, published 2024)
- ISM – Supply chain and procurement performance benchmarks
Select your peer group carefully—adjust for company size, industry, and procurement maturity level to ensure fair comparisons. A $200M manufacturer shouldn't benchmark against a Fortune 100 retailer.
Document a current-state baseline across all selected KPIs. This baseline is what you'll measure improvement against over time.
Step 4 – Identify Gaps and Root Causes
Raw gap data doesn't explain why performance lags. Root cause diagnosis does:
- A longer-than-benchmark PO cycle time might stem from approval workflow complexity, not supplier responsiveness
- A low contract compliance rate might reflect poor category coverage, not employee negligence
- Below-average spend under management often traces to tail spend left outside procurement's scope
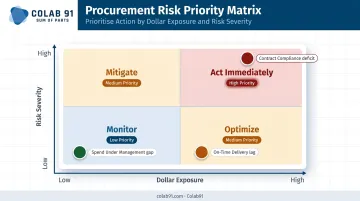
Prioritize gaps by business impact. Not all gaps are equal. A 15-percentage-point deficit in spend under management at a company with $300M in third-party spend represents a fundamentally different opportunity than a 5-point lag in on-time delivery from a non-critical supplier.
Rank gaps by dollar exposure and risk severity, then sequence improvement actions accordingly.
Step 5 – Act, Monitor, and Iterate
Diagnosis only creates value when it drives action. Each identified gap needs a committed owner, a specific improvement action, a delivery timeline, and a measurable success metric—documented and tracked, not just discussed.
From there, shift from annual benchmarking cycles to continuous monitoring. Embed KPI dashboards into procurement workflows so deviations are caught early—before they become systemic. Leading organizations review procurement KPIs at least quarterly, aligned to business planning cycles.
Procurement Benchmarking in Action: A Practical Walkthrough
Consider a mid-market company in a PE portfolio under pressure to demonstrate procurement savings ahead of a value creation review. The CPO has a four-person team, two ERPs with inconsistent spend data, and no clear view of whether current performance is competitive.
How the benchmarking process plays out:
Define KPIs tied to EBITDA: The team picks three: savings rate, spend under management, and supplier on-time delivery—all directly mappable to the PE sponsor's value creation scorecard
Consolidate spend data: Spend from both ERPs is normalized into a unified view with consistent supplier and category classification—revealing that roughly 28% of spend was sitting in tail suppliers with no contract coverage
Compare against benchmarks: Against Ardent Partners and APQC peer data, spend under management is 14 points below average; contract compliance is lagging because tail spend is running entirely outside procurement channels
Diagnose root causes: The compliance gap isn't process non-adherence—it's a coverage problem. Categories were simply never brought under management
Convert to actions: Three spend categories get prioritized for immediate sourcing events; guardrails are established to channel maverick spend back through contract channels; a quarterly dashboard tracks cycle time and compliance trends
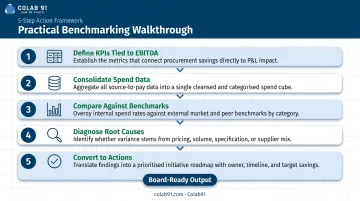
The output is a board-ready improvement roadmap with projected savings tied directly to addressable spend—not procurement jargon.
The team also stays disciplined about what not to do:
- Benchmarking every possible metric at once instead of focusing on what moves EBITDA
- Relying on self-reported industry surveys that skew toward best-case performance
- Presenting findings in operational terms rather than translating them into financial impact
Common Benchmarking Pitfalls to Avoid
Measuring activity instead of outcomes. Benchmarking the number of sourcing events or supplier count looks productive but reveals nothing about competitive standing. Savings rate, compliance rate, and cost per PO are the metrics that matter.
Using static or outdated benchmarks. Annual consultant reports lose relevance fast. Deloitte's 2023 CPO Survey found inflation affected 89% of firms and supply shortages hit 79%—market conditions that shift benchmarks materially within a single year.
Siloing benchmarking within procurement. When finance and procurement track different versions of the same metrics, alignment breaks down. The most effective programs are built around shared KPI definitions and cross-functional ownership of improvement targets. That alignment matters most on the reconciliation CFOs scrutinize most: savings realized versus savings identified.
How Colab91 Can Help
Mid-market and PE-backed companies face a specific problem with procurement benchmarking: the intent is there, but the internal analytics capacity to do it consistently isn't.
Colab91 builds dedicated offshore procurement and spend analytics teams in India that serve as the operational backbone for ongoing benchmarking programs. The workstreams these teams own include:
- Spend data normalization and taxonomy classification
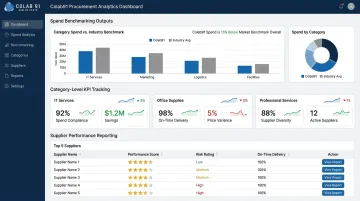
- Procurement KPI dashboard build and maintenance
- Category-level benchmark analysis
- Supplier performance analytics and reporting
- Contract compliance tracking
- Board-ready procurement intelligence packages on weekly and monthly cadences
The differentiator is domain depth, not offshore capacity alone. Managing Partners Madhur Kabra and Vijender Kapoor (both formerly of Impendi, acquired by Accenture) built and scaled procurement analytics delivery for PE sponsors including Carlyle Group, TPG, Elliott, and BC Partners.
These clients don't need offshore bodies. They need teams that understand how a contract compliance dashboard connects to EBITDA, and how to present procurement performance in terms that move a board conversation.
The engagement model is designed for speed. Colab91's Savings Opportunity Assessment delivers a quantified, category-by-category savings roadmap within 4–6 weeks, typically identifying 5–15% of addressable spend in savings potential.
From there, dedicated offshore analytics teams provide continuous procurement intelligence, moving clients from fragmented spend data to actionable benchmarking dashboards without the cost or lead time of building an in-house analytics function.
Conclusion
Procurement benchmarking is not a reporting exercise. It's how procurement functions earn credibility with boards and PE sponsors—by translating spend, supplier, and cycle time data into decisions that protect margins and reduce supplier risk at a scale that shows up in the P&L.
The discipline only works when it's continuous. That means:
- KPIs reviewed quarterly, not at year-end
- Benchmarks updated as market conditions and supplier landscapes shift
- Improvement plans tied to revenue and margin outcomes, not internal process metrics
Teams that run benchmarking this way sustain leadership buy-in because every review produces a decision, not just a report.
Frequently Asked Questions
What is a benchmark in procurement?
A procurement benchmark is an external reference point—a standardized metric like cost savings percentage, PO cycle time, or supplier on-time delivery—used to compare your procurement performance against industry peers or top performers. Unlike internal KPIs, benchmarks answer whether your performance is competitive, not just whether it's improving.
What are the KPI benchmarks for procurement?
Core procurement KPIs span six categories — and leading teams track them together, not in isolation:
- Cost savings as a percentage of addressable spend
- PO cycle time and cost per purchase order (APQC median: $55)
- Spend under management (industry average: 71% of enterprise spend)
- Contract compliance rate and supplier on-time delivery (APQC median: 90%)
What are the different types of procurement benchmarking?
Three types: internal benchmarking (your own historical trends), industry benchmarking (sector peers), and best-in-class benchmarking (top performers regardless of industry). Each answers a different question — mature programs run all three in parallel.
How often should procurement teams run benchmarking?
Leading organizations treat benchmarking as a continuous process, using live dashboards and real-time KPI tracking rather than annual reviews. At minimum, formal benchmark reviews should happen quarterly to align with business planning cycles and catch performance deviations before they compound.
What are the most common mistakes in procurement benchmarking?
Three pitfalls consistently derail benchmarking programs: tracking activity metrics instead of outcome metrics, relying on outdated or self-reported data, and misaligning procurement and finance on KPI definitions. Each one quietly corrupts the outputs — often before anyone notices.
How do mid-market companies get started with procurement benchmarking?
Start narrow: pick three to five high-impact KPIs tied to your current business priorities, consolidate spend data into a single normalized view, and compare against one credible external source (APQC or Hackett Group). Working with an experienced analytics partner can compress the foundation-building phase from quarters into weeks.