Introduction
Most mid-market and PE-backed companies are sitting on a goldmine of procurement data they never actually use. Purchase orders, invoices, supplier contracts, and payment records flow through the organization daily. Yet most of it stays siloed across ERP systems, AP platforms, and spreadsheets, with no one connecting the dots.
Maverick spending goes undetected, supplier performance issues surface too late, and finance leaders make cash flow decisions without visibility into what's actually been committed.
Procure to pay analytics changes this. It converts raw P2P cycle data into decision-ready intelligence across spend visibility, supplier performance, payment optimization, and fraud detection. The business case is substantial: according to The Hackett Group's 2024 Digital World Class benchmark, digitally mature procurement organizations achieve 21% lower cost to deliver and 76% lower purchase cost per order compared to their peers. Those numbers reflect what's possible when organizations stop leaving procurement data on the table.
This article breaks down what P2P analytics is, where it applies across the procurement cycle, and which use cases deliver the most immediate value.
Key Takeaways
- P2P analytics aggregates and analyzes data across the entire procurement-to-payment cycle to surface inefficiencies and drive smarter decisions.
- End-to-end coverage - from purchase requisition through invoice payment - means no stage of the cycle escapes scrutiny.
- Primary use cases include spend analysis, supplier performance management, bottleneck detection, payment optimization, and fraud detection.
- Metrics that matter most: P2P cycle time, on-time delivery rate, invoice processing cost, spend under management, and PO compliance rate.
- Organizations that embed analytics into P2P consistently reduce maverick spend and shorten invoice cycle times - often without adding headcount.
What Is Procure to Pay Analytics?
P2P analytics is the process of aggregating, organizing, and analyzing data generated across the procurement and accounts payable cycle-from need identification and purchase requisition through to vendor payment-to reveal insights that improve financial and operational performance.
It sits at the intersection of procurement and finance. Procurement sees what is being bought, from whom, and at what price. Finance tracks how and when those payments are made. P2P analytics connects both views, giving organizations end-to-end visibility that neither function can achieve independently.
Reporting vs. Active Analytics
P2P analytics is not the same as running ERP reports or exporting AP data into a spreadsheet.
Passive data collection tells you what happened. Active analytics tells you what it means and what to do about it. The difference plays out in two modes:
- Descriptive analytics - spend by category, supplier, or cost center; invoice exception rates; payment timing patterns
- Predictive/prescriptive analytics - forecasting cash flow gaps, flagging at-risk suppliers before disruptions occur, recommending payment term adjustments to optimize working capital
According to Deloitte's 2023 CPO Survey, only 25% of organizations can identify and predict supply disruptions in a timely manner "to a large extent." According to Deloitte's 2023 CPO Survey, only 25% of organizations can identify and predict supply disruptions in a timely manner "to a large extent." Most mid-market organizations are still operating in descriptive mode - which is precisely where the analytical opportunity is largest.
The P2P Cycle: Where Analytics Comes In
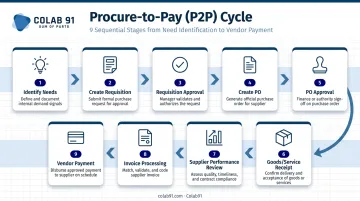
CIPS defines the procure-to-pay process as covering nine sequential stages, each generating data that carries analytical value:
- Identify needs - demand forecasting, budget alignment
- Create requisition - requestor, cost center, category classification
- Requisition approval - approval time, compliance check
- Create purchase order - PO linkage, vendor selection
- PO approval - authorization level, cycle time
- Goods/service receipt - delivery confirmation, three-way match
- Supplier performance review - KPI tracking against contract terms
- Invoice processing - exception rates, matching accuracy
- Vendor payment - payment timing, DPO, early discount capture
The Fragmentation Problem
The challenge is that these nine stages rarely live in one system. Procurement data sits in ERP platforms, AP lives in a separate tool, contracts are in a document management system, and supplier communications happen via email. No single team sees the full picture.
This fragmentation hits hardest in mid-market companies, where much of the P2P process is manual or spread across disconnected tools. An analytics function - whether built in-house or through a dedicated offshore team - solves this by unifying the data. Decision-makers can finally see the full cycle, not just isolated snapshots.
Key Use Cases of P2P Analytics
P2P analytics delivers the most value when applied to specific, high-impact problems. Below are five use cases that cover the breadth of the cycle.
Spend Analysis and Category Intelligence
Spend analysis is the foundational use case. It aggregates spend data across suppliers, categories, cost centers, and geographies to answer a simple question: where is money actually going versus where it is budgeted to go?
Three things typically surface:
- Maverick spending - purchases made outside approved contracts or preferred suppliers
- Spend concentration risk - over-reliance on a single vendor in a critical category
- Consolidation opportunities - multiple departments buying identical items from different vendors at different prices
Hackett Group data shows that digitally mature procurement teams experience 59% less savings loss from maverick buying and contract non-compliance. For a mid-market company spending $200M annually, that gap translates directly to the bottom line.
Best-in-class procurement organizations achieve 91.7% spend under management, compared to roughly 71% for average performers. That 20-point gap represents substantial unrealized savings potential.
Supplier Performance Management
Supplier performance management turns anecdotal concerns into quantified, contract-linked evidence. P2P analytics tracks KPIs documented in supplier agreements and enables benchmarking across suppliers in the same category.
Key metrics typically monitored include:
- On-time delivery rate
- Percentage of deliveries received in full
- Defect and return rates
- Service level adherence
When a supplier's on-time delivery drops from 94% to 81% over three quarters, that trend should trigger a structured review-not an emergency response. Analytics makes that visibility continuous rather than retrospective.
McKinsey estimates that supply chain disruptions over a decade typically equal 30% of one year's EBITDA. That figure reframes proactive supplier monitoring as risk management, not overhead.
Workflow Bottleneck Detection
Cycle time analytics measures elapsed time at each stage of the P2P process-requisition creation to PO approval, goods receipt to invoice matching, invoice approval to payment-and surfaces exactly where delays occur.
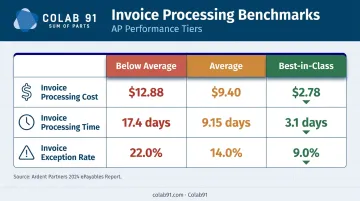
Industry benchmarks from Ardent Partners' 2024 ePayables report reveal how wide performance gaps can be:
| Metric | Below Average | Average | Best-in-Class |
|---|---|---|---|
| Invoice processing cost | $12.88 | $9.40 | $2.78 |
| Invoice processing time | 17.4 days | 9.15 days | 3.1 days |
| Invoice exception rate | 22.0% | 14.0% | 9.0% |
A company processing 50,000 invoices annually at $9.40 each is spending $470,000 on AP management. Best-in-class organizations process the same volume for $139,000. Knowing where your organization falls in that range-and why-is exactly what bottleneck analytics provides.
Payment Optimization and Cash Flow Management
Payment analytics surfaces three distinct opportunities most organizations are leaving on the table:
- Late payments - Atradius' 2025 US payment survey found 43% of B2B invoices by value are overdue, exposing both buyers and suppliers to financial strain
- Missed early-payment discounts - most available early-payment discounts go uncaptured, representing a direct yield opportunity
- DPO optimization - APQC benchmarks show median Days Payable Outstanding at 40 days, with the 75th percentile at 53+ days; understanding where you sit helps inform targeted working capital strategy
Payment analytics connects invoice-level data to cash flow forecasting. It also identifies payment terms across the supplier base that could be renegotiated-a conversation that requires data, not intuition.
Risk Detection and Fraud Prevention
Procurement fraud rarely announces itself-and manual review processes aren't built to find it. The ACFE's 2024 Report to the Nations estimates the typical organization loses 5% of annual revenue to fraud, with billing fraud carrying a $100,000 median loss.
In P2P specifically, analytics flags patterns that humans routinely miss:
- Invoices with no matching purchase order
- Split POs structured to stay below approval thresholds
- Duplicate invoices submitted across slightly different vendor names
- One-time or dormant vendors reactivated with payment requests
- Invoice prices deviating from contracted rates
- Employees registered as active suppliers
APQC benchmarks show the median organization processes 1.5% of annual disbursements as duplicate or erroneous payments-a recoverable loss that scales with transaction volume.
Key Metrics to Track in P2P Analytics
Metric selection should map to specific operational goals. Not every organization needs to track everything on day one. These five metrics cover the cycle end-to-end - from requisition to payment:
P2P Cycle Time The elapsed time from purchase requisition creation to final vendor payment. Formula: Cycle Time = Payment Date − Requisition Date Long cycle times signal approval bottlenecks, slow invoice processing, or poor PO compliance. Use industry benchmarks to determine whether your cycle time reflects a process design problem or a compliance gap.
Supplier On-Time Delivery Rate Calculated as: deliveries on time ÷ total deliveries × 100. Tracked by supplier and category, this is the most direct proxy for supply reliability and the strongest basis for supplier review conversations.
Invoice Processing Cost Total AP management costs divided by number of invoices processed. This metric quantifies the operational cost of manual or inefficient invoice handling, and directly supports the business case for automation. Best-in-class organizations process invoices at $2.78 each; the average sits at $12.88 - a gap that compounds significantly across thousands of annual transactions.
Spend Under Management (Contract Compliance Rate) The percentage of total spend flowing through approved contracts or preferred suppliers. Low rates indicate high maverick spend and untapped savings. Best-in-class organizations hit 91.7%; average organizations sit at roughly 71%.
PO Compliance Rate The percentage of purchases initiated with a proper purchase order before goods or services are received. Low PO compliance is both a financial control risk and the root cause of invoice-matching failures. Ardent Partners found that best-in-class AP organizations link 83.7% of invoices to a PO, versus 48.2% for lower performers.
How Colab91 Helps Build Your P2P Analytics Capability
Most mid-market and PE-backed companies recognize the value of P2P analytics but face a concrete obstacle: they do not have the internal headcount, domain depth, or data infrastructure to build it from scratch. Hiring a full procurement analytics team in-house is expensive and slow. Generic BPO providers offer process execution, not analytical insight.
Colab91 builds dedicated India-based capability centers staffed with procurement analytics practitioners - covering spend analysis, supplier performance tracking, P2P reporting, and data operations. Clients gain an always-on analytics function without standing up an entirely new department.
Domain Experience That Matters
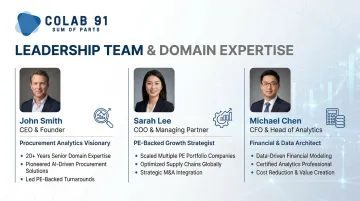
Colab91's leadership team spent 16+ years building and scaling procurement analytics operations before founding the company. The result is a delivery team shaped by real engagements - not staffing agency economics.
Key credentials:
- Madhur Kabra (Managing Partner) - former Country Head of Impendi India (acquired by Accenture), scaled a 100+ practitioner organization serving Carlyle Group and TPG
- Vijender Kapoor (Managing Partner) - former Principal at Impendi, with a track record designing delivery models for Fortune 100 firms and PE portfolio businesses
- Erika Jung (Advisor) - CPO-level experience leading procurement transformation at healthcare organizations including Pediatric Associates (TPG portfolio) and Kindred Healthcare
The Engagement Model
Colab91's "Sum of Parts" approach augments a client's existing procurement and finance team with dedicated offshore talent - it extends what's already there rather than displacing it. The model is designed for mid-market companies that need deep analytics capability without the overhead of a full internal build. Engagements are structured to fit the size, scope, and complexity of each client's operations.
Conclusion
P2P analytics gives procurement teams something they rarely have: a clear, quantified view of where money is going, where risk is accumulating, and where process gaps are costing the business. That visibility is as valuable for a $500M mid-market company as it is for a Fortune 100 enterprise.
The maturity curve matters here. Early-stage programs typically focus on spend visibility and invoice processing efficiency. As data quality improves and teams build analytical fluency, the scope expands - from category reporting to supplier risk monitoring to working capital optimization. Each layer compounds the value of the last.
For mid-market and PE-backed companies, the decision isn't whether to pursue P2P analytics - it's how fast to build the capability. Teams with access to domain expertise in procurement and analytics tend to reach meaningful insights faster, without the trial-and-error of building from scratch.
Frequently Asked Questions
What is procure-to-pay (P2P) analysis?
P2P analysis is the practice of collecting and interpreting data across the procurement and payment cycle-from purchase requisition to vendor payment-to identify inefficiencies, reduce costs, and improve supplier and financial performance. Unlike standard reporting, it surfaces patterns, anomalies, and actionable opportunities that transactional data alone won't reveal.
What are the steps in the procure-to-pay (P2P) cycle?
The core stages are: need identification, purchase requisition, PO creation and approval, goods or service receipt, invoice processing and three-way matching, and vendor payment. Analytics adds value at each step, from flagging approval bottlenecks to optimising payment timing.
What does a procure-to-pay analyst do?
A P2P analyst aggregates and interprets procurement and AP data to track KPIs, identify workflow bottlenecks and compliance gaps, support supplier performance reviews, and produce reporting that enables procurement and finance leaders to make data-driven decisions. The role bridges transactional data and strategic insight.
Which is better, P2P or R2R?
P2P (procure-to-pay) and R2R (record-to-report) serve different functions-P2P governs the purchasing and payment cycle while R2R covers financial close and reporting. They are complementary; most organisations benefit from maturing both rather than choosing between them.
What are the key metrics tracked in P2P analytics?
The core metrics are: P2P cycle time, supplier on-time delivery rate, invoice processing cost, spend under management (contract compliance rate), and PO compliance rate.
How does P2P analytics help with fraud and risk detection?
P2P analytics flags anomalies that manual review consistently misses at scale-invoices without matching POs, split purchase orders designed to avoid approval thresholds, duplicate vendor entries, and pricing deviations from contracted rates. Given that the ACFE estimates organisations lose 5% of revenue annually to fraud, systematic detection is far more reliable than periodic audits.