Introduction
Most procurement teams apply the same process to ordering office pens as they do to sourcing a mission-critical manufacturing component. Same approval workflow, same supplier outreach cadence, same level of attention. That misaligned effort — not laziness, but structural indifference — is precisely what the Kraljic Matrix was built to fix.
For mid-market and PE-backed companies, the stakes are real. According to a 2024 Gartner survey of 258 procurement leaders, 42% identified supply disruptions as the foremost risk to procurement's future success.
The Deloitte 2023 Global CPO Survey puts the trend in sharper relief: 43% of CPOs said overall procurement risk had increased significantly — more than double the 20% who said the same in 2021.
Undifferentiated purchasing makes both risks worse. When teams can't distinguish high-stakes categories from low-stakes ones, they over-invest in trivial suppliers and under-protect critical ones. The Kraljic Matrix solves that problem by giving procurement a structured way to allocate effort where risk and spend actually diverge.
TL;DR
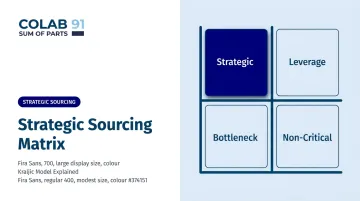
- The Kraljic Matrix segments your entire purchasing portfolio using two axes: profit impact and supply risk
- Four quadrants emerge from that mapping (Non-Critical, Leverage, Bottleneck, and Strategic), each calling for a fundamentally different sourcing strategy
- The model redirects procurement effort toward high-impact categories and eliminates wasted attention on low-value spend
- Treat it as a living tool: market shifts, supplier changes, and strategy updates can all move items between quadrants
- First published in 1983, the framework pairs naturally with modern spend analytics and AI tools — making it as relevant today as ever
What Is the Kraljic Matrix?
The Kraljic Matrix is a strategic procurement framework that segments an organization's purchasing portfolio into four categories based on two dimensions — profit (or value) impact and supply risk — to enable differentiated sourcing strategies rather than a one-size-fits-all approach.
That framework traces back to Peter Kraljic, who introduced it in his September 1983 Harvard Business Review article, "Purchasing Must Become Supply Management." His core argument: purchasing managers needed to stop thinking transactionally and start managing supply markets strategically. The model drew from risk management principles and applied them directly to procurement portfolio decisions.
Where It Fits in Procurement Practice
The matrix is used to:
- Set category-level sourcing strategies
- Guide how much supplier relationship management (SRM) investment each category deserves
- Prioritize limited procurement resources across a complex spend portfolio
- Pair with spend analysis, total cost of ownership models, and market intelligence for ongoing decision-making
The Chartered Institute of Procurement & Supply (CIPS) currently maintains dedicated Kraljic Matrix guidance, describing it as a tool used to identify and minimize supply risks — which explains why it remains a baseline competency in formal procurement certification programs four decades after its introduction.
The Four Quadrants of the Kraljic Matrix
The matrix plots purchases on a 2×2 grid. The Y-axis measures profit (value) impact — how significantly the purchase affects cost, operations, or revenue. The X-axis measures supply risk — how difficult, volatile, or concentrated the supply market is. Each combination produces a distinct procurement posture.
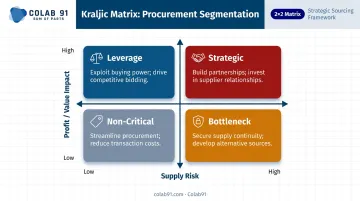
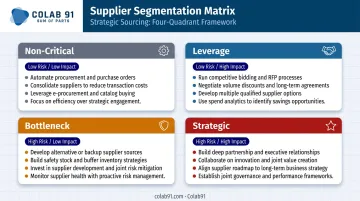
Non-Critical Items (Low Impact, Low Risk)
These are purchases that are widely available, easy to substitute, and contribute minimally to operations: office stationery, janitorial supplies, low-value MRO. Disruption risk is low; profit consequence is negligible.
The goal here is administrative efficiency, not strategic engagement. - Standardize specs and consolidate to fewer suppliers
- Automate purchasing through catalogs or P-cards
- Eliminate manual processing time wherever possible
Leverage Items (High Impact, Low Risk)
High spend or operationally significant items sourced from a competitive, fragmented supplier market — bulk raw materials, energy supplies, transportation. The buyer holds strong negotiating power here.
Put that negotiating power to work:
- Consolidate volumes across business units to maximize leverage
- Run competitive RFPs or e-auctions to drive price tension
- Evaluate total cost of ownership, not just unit price
- Re-bid periodically to prevent supplier complacency
Bottleneck Items (Low Impact, High Risk)
Modest spend, but sourced from a limited supplier base or requiring specialized technical capabilities — proprietary components, niche software licenses, specialty coatings. A disruption here can halt operations despite the low direct cost.
Supply assurance takes priority over price optimization:
- Secure long-term agreements with guaranteed allocation rights
- Qualify alternative sources before you need them
- Maintain safety stock calibrated to lead times and criticality
- Monitor supplier financial health on an ongoing basis
Strategic Items (High Impact, High Risk)
The highest-stakes quadrant. Items that are both critical to core operations and difficult to source reliably: key manufacturing components, active pharmaceutical ingredients, specialized services for PE portfolios. Supply disruptions carry financial, reputational, and operational consequences.
This quadrant demands the deepest investment:
- Build executive-level supplier relationships with joint business plans and risk-sharing contracts
- Pursue dual-sourcing or nearshoring where geopolitical exposure is elevated
- Embed supplier collaboration directly into product or service planning cycles
- Treat top strategic suppliers as partners, not vendors
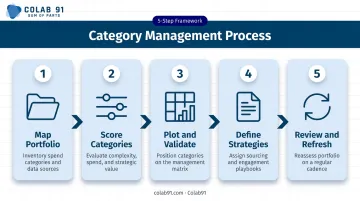
How to Apply the Kraljic Matrix: Step by Step
Applying the matrix effectively is a structured analytical process. It is not a one-time exercise. The most common failure is treating it as a static chart rather than a dynamic decision tool.
Step 1 – Map Your Purchasing Portfolio
Collect a comprehensive inventory of all goods and services purchased, organized by:
- Category and subcategory
- Supplier name and concentration
- Annual spend and usage frequency
- Contract status and expiration dates
This requires clean, structured spend data — a gap many mid-market companies face without dedicated procurement analytics capability.
Step 2 – Score Each Category on Both Axes
Go beyond raw spend when assessing profit impact:
- Revenue-at-risk if supply fails
- Share of COGS
- Operational downtime cost
- Time and cost to switch suppliers
Score supply risk on: supplier concentration, lead time volatility, substitutability, IP lock-in, and geopolitical exposure. Use a consistent scale (1–5) and validate with cross-functional input from finance, operations, and engineering.
Step 3 – Plot Items and Validate
Place each category in the appropriate quadrant. Flag close calls for cross-functional review, as misclassification is the most common error. Treating "IT" as a single dot, for example, misses the fact that SaaS licenses and commodity hardware carry very different risk profiles.
Step 4 – Define Sourcing Strategies per Quadrant
Translate quadrant placement into actionable category playbooks:
| Quadrant | Sourcing Posture |
|---|---|
| Non-Critical | Automate and standardize |
| Leverage | Compete aggressively |
| Bottleneck | Secure supply first |
| Strategic | Partner and co-invest |
Document strategies and align procurement, finance, and business unit owners before execution.
Step 5 – Review and Refresh Regularly
Items move between quadrants as conditions change. Set a review cadence: annually at minimum, semi-annually for high-risk categories. Trigger an off-cycle review when any of the following occur:
- A key supplier is acquired or exits the market
- Late deliveries signal supply chain stress
- A major contract is approaching expiration
- Geopolitical events affect sourcing geography
Kraljic Matrix in Practice: A Procurement Walkthrough
Consider a mid-market industrial manufacturer with 400+ active supplier relationships, fragmented spend data, and limited procurement headcount — a profile Colab91's teams encounter regularly with PE-backed portfolio companies entering a value creation phase.
When the procurement team runs a Kraljic analysis, three things surface:
- 60% of spend sits in leverage categories (fasteners, standard materials) where no competitive bids have been run in years — savings have been left on the table
- A critical custom component supplier falls squarely in the strategic quadrant but has no formal partnership agreement, no dual-source contingency, and no executive-level relationship
- A specialty coating is logged as non-critical when it is, in fact, a bottleneck risk — a single-source supplier with a 14-week lead time
With the matrix applied, the response is clear:
- Run RFPs across leverage categories → capture price reductions through competitive tension
- Establish a long-term agreement with the strategic component supplier → formalize relationship, secure allocation rights
- Qualify a backup coating source → eliminate single-source exposure
The outcome is measurable: cost reduction, supply continuity, and a stronger value creation story heading into a potential exit. These are the improvements a McKinsey analysis of PE procurement directly ties to EBITDA gains during hold periods.
Common Pitfalls and Limitations
The Kraljic Matrix gives procurement teams a structured place to start. Three recurring pitfalls, however, limit its reliability when applied without additional rigor.
Misclassification via Spend Proxy
Using spend volume as the only measure of profit impact routinely misplaces high-criticality, low-spend items. A $20K specialty component that halts a $5M production line belongs in the strategic or bottleneck quadrant — not non-critical. Build your impact score from downtime cost, switching time, and revenue-at-risk, not spend alone.
The Static Snapshot Problem
The matrix reflects conditions at a point in time. The auto semiconductor shortage is the clearest modern example: components that appeared low-risk became existential bottlenecks almost overnight. Without a defined refresh cadence, outdated classifications drive misplaced strategies — over-investing in supplier relationships that no longer matter, or under-managing a newly volatile supply market.
Inherent Oversimplification
Two dimensions cannot capture everything relevant to category strategy. ESG risk, innovation potential, total lifecycle cost, and regulatory compliance all influence sourcing decisions but sit entirely outside the matrix's scope. The subjective weighting of factors — and the arbitrary line between "high" and "low" on each axis — remain genuine challenges in practice.
The matrix works best when supported by spend analytics, supplier risk data, and cross-functional judgment. Treat it as the starting point for category strategy, not the endpoint.
How Colab91 Can Help
For mid-market and PE-backed companies that want to operationalize the Kraljic Matrix, the bottleneck is rarely understanding the framework — it's having the procurement analytics bandwidth to apply it consistently and keep it current.
Colab91's offshore capability centers run ongoing spend analysis, category scoring, and matrix refresh cycles as a managed function — not a one-time consulting engagement. The leadership team previously scaled Impendi's India operations to 100+ practitioners serving Carlyle Group, TPG, Elliott, and BC Partners, bringing that same institutional rigor to mid-market procurement programs. Classifications stay current as markets shift.

PE-backed portfolios can start with Colab91's Savings Opportunity Assessment & Procurement Diagnostic, which completes an initial portfolio segmentation within 4–6 weeks — typically surfacing 5–15% of addressable spend in savings opportunities with a category-by-category attack plan.
Delivery combines two inputs:
- AI-powered spend classification through Colab91's spend analytics platform
- Human analyst judgment on category strategy, supplier dynamics, and market context
Erika Jung, Colab91's advisor and former CPO at Pediatric Associates (a TPG portfolio company), provides the onshore strategic layer — translating procurement priorities into executive-aligned sourcing strategies that PE operating partners can take directly to portfolio leadership.
The model is straightforward: onshore strategic guidance paired with offshore delivery efficiency, so clients get seasoned procurement capability without the cost or timeline of building an in-house function from scratch.
Conclusion
The Kraljic Matrix works because it forces a simple but uncomfortable question: are we allocating procurement effort based on actual business impact, or just habit? By answering that question rigorously — quadrant by quadrant, category by category — teams cut costs in the right places, reduce supply chain exposure, and build supplier relationships that hold up when markets get difficult.
The matrix only delivers that value if it's revisited regularly — not filed away after the initial categorization exercise. Market conditions shift, sole-source risks emerge, and strategic priorities change. Teams that reassess their quadrant assignments annually, or after major supply disruptions, consistently outperform those that treat the model as a one-time output.
Frequently Asked Questions
What are the four quadrants of the Kraljic Matrix?
The four quadrants are Non-Critical (low impact, low risk), Leverage (high impact, low risk), Bottleneck (low impact, high risk), and Strategic (high impact, high risk). Each requires a distinct sourcing and supplier management approach — from automated procurement for non-critical items to executive-level partnerships for strategic ones.
Is the Kraljic Matrix still relevant?
Yes, and supply chain conditions have only made it more relevant since its introduction in 1983. Increasing volatility, geopolitical risk, and single-source dependencies have made differentiated procurement strategies more critical than ever. Modern practitioners augment the matrix with spend analytics, AI tools, and live supplier risk data to keep classifications current.
How do I measure profit impact beyond just spend volume?
Look beyond the invoice. Key metrics include revenue-at-risk if supply is disrupted, share of COGS, operational downtime cost, and the time and cost required to switch to an alternative supplier. These factors often reveal that low-spend categories carry far greater strategic weight than raw spend figures suggest.
How often should the Kraljic Matrix be reviewed and updated?
At minimum annually, with semi-annual refreshes for high-risk categories. Beyond the scheduled cadence, trigger an immediate review whenever there's significant market disruption, supplier M&A activity, a major delivery failure, or a shift in business strategy — any of which can move categories between quadrants.
What are the key components of a Supplier Relationship Management (SRM) framework?
Core SRM components include supplier segmentation, performance measurement (KPIs and scorecards), governance cadence, risk monitoring, and joint value creation programs. The Kraljic Matrix directly determines which suppliers warrant deeper SRM investment — strategic quadrant suppliers merit executive engagement; non-critical ones do not.
What is the difference between the Kraljic Matrix and the Supplier Preferencing Matrix?
The Kraljic Matrix helps buyers assess how they should view suppliers, based on impact and risk. The Supplier Preferencing Matrix flips the perspective — showing how suppliers view the buying organization based on account attractiveness and spend level. Using both together reveals whether the relationship is aligned or fundamentally mismatched.