Introduction
PE sponsors face a real accountability problem: without external reference points, internal improvement looks like progress even when the market expects more. A portfolio company cutting SG&A by 200 basis points sounds strong — until you benchmark it against sector peers and find competitors running 400 basis points leaner.
Benchmarking data tools solve this by giving deal teams and operating partners the external reference points needed to set credible targets, prioritize value creation initiatives, and track progress against industry norms — not just prior-year performance.
This guide covers five benchmarking tools PE firms use at the portfolio company level — along with the selection criteria and tool-stack logic that determine which combination fits your firm's operational focus:
- PitchBook
- S&P Capital IQ Pro
- Preqin
- iLEVEL by S&P Global
- The Hackett Group
Key Takeaways
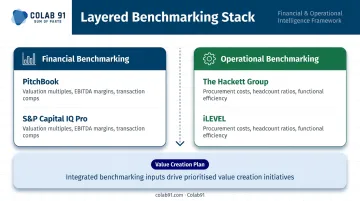
- PE benchmarking tools fall into two categories: financial benchmarking (margins, multiples, growth vs. peers) and operational benchmarking (procurement costs, SG&A ratios, functional efficiency).
- No single tool covers both categories — leading firms layer two to three platforms across the investment lifecycle.
- Each tool serves a distinct purpose: deal-team analytics, fund performance tracking, portfolio KPI aggregation, or functional cost diagnostics.
- Tool selection hinges on data specificity, PE workflow fit, and your team's capacity to act on the outputs.
- The data itself does nothing — value comes from translating outputs into prioritized, executable initiatives.
What Is PE Benchmarking Data — and Why Does It Matter?
PE benchmarking data is external, peer-referenced information that allows sponsors and operating partners to compare a portfolio company's performance against industry-specific norms and comparable companies.
Two Categories That Serve Different Purposes
Financial benchmarking answers the question: how does this company's performance compare to its market peers?
- Revenue growth vs. sector comps
- EBITDA margins vs. comparable companies
- Leverage ratios and valuation multiples
- IRR, TVPI, DPI, and RVPI for fund-level context
Operational benchmarking goes deeper: why is performance below peer levels, and which functions are driving the gap?
- Procurement spend as a percentage of revenue
- Finance headcount ratios per $1B revenue
- SG&A cost efficiency vs. best-in-class
- Cycle time, transaction costs, and process productivity metrics
Where Benchmarking Fits the Investment Lifecycle
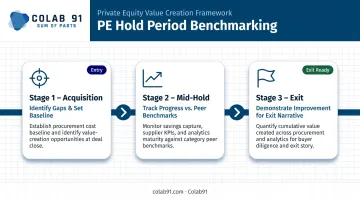
These two lenses apply across the hold period. PE sponsors use benchmarking at three stages:
- At acquisition — identify improvement gaps and set the baseline for the value creation plan
- Mid-hold — track whether initiatives are moving performance toward peer benchmarks
- At exit — demonstrate operational improvement relative to sector peers, supporting a stronger exit narrative
A company can improve every year and still exit well below what a well-run peer looks like to a strategic buyer. External benchmarks are what make the gap visible — and closeable.
Top 5 Private Equity Benchmarking Data Tools for Portfolio Companies
These tools were selected based on their relevance to PE portfolio company use cases. Each one serves a distinct function — financial peer comparison, operational cost analysis, cross-portfolio KPI tracking, or value creation reporting — so the right choice depends on what gap you're trying to close.
PitchBook
PitchBook is one of the most widely used financial data platforms in private equity. Its comparable company analysis functionality lets deal teams build precise peer sets for each portfolio company — filtering by sector, revenue band, geography, and ownership structure — rather than relying on generic industry averages.
For benchmarking specifically, PitchBook covers valuation multiples (EV/Sales, P/E, P/B, P/S), EBITDA, gross profit, and capex estimates across public and private peers. Its Private Market Benchmarks add fund-performance comparisons by vintage, IRR, TVPI, DPI, RVPI, performance quartiles, and PME analysis. The Excel export capability makes it practical for analysts building or updating financial models.
| Attribute | Detail |
|---|---|
| Best For | Financial benchmarking, valuation comp sets, sector-level growth and margin comparisons |
| Key Features | Comparable company analysis, deal multiple databases, private market benchmarks, thousands of screening filters |
| Pricing / Access | Demo and free-trial based; no public pricing — contact PitchBook for enterprise access |
S&P Capital IQ Pro
S&P Capital IQ Pro is the other dominant deal-team benchmarking platform. It covers 60M+ private companies, 110,000+ PE/VC funds, and 1.2M M&A transactions — giving analysts deep transaction comp databases alongside company financial benchmarks.
The Excel plug-in is its most practical differentiator for PE workflows: analysts pull live benchmarking data directly into financial models without switching platforms. This makes it the preferred tool for structured peer comparisons during diligence and for board-level reporting that needs to reference up-to-date sector benchmarks. S&P's PE-focused pages also support fund performance benchmarking against market peers.
| Attribute | Detail |
|---|---|
| Best For | Peer financial benchmarking, transaction comps, financial modeling with live data |
| Key Features | Peer screening by financials and sector, transaction multiple databases, Excel plug-in, real-time data updates |
| Pricing / Access | Subscription-based, quote-driven; request demo through S&P Global Market Intelligence |
Preqin
Preqin is built specifically for fund-performance benchmarking. With 140,000+ private capital benchmarks drawn from 50+ years of returns data across 13,500+ private capital funds, it's the strongest platform available for vintage-year comparisons, quartile rankings, and LP reporting context.
GPs use Preqin benchmarks to position fund performance relative to peers in marketing materials and LP communications. LPs use it to evaluate risk-return profiles against asset-class benchmarks. The platform is not designed for portfolio company operating KPI diagnostics. That's a deliberate trade-off. What it does fill — and what PitchBook and Capital IQ don't cover the same way — is externally validated fund performance context.
| Attribute | Detail |
|---|---|
| Best For | Fund and portfolio performance benchmarking, LP reporting, IRR and multiple comparisons |
| Key Features | Fund performance benchmarks by vintage and strategy, TVPI/DPI/RVPI data, quartile rankings, pooled Net IRR |
| Pricing / Access | Free benchmarks available; Preqin Pro subscription and enterprise data solutions via demo request |
iLEVEL by S&P Global
iLEVEL (currently branded under S&P Global Market Intelligence, used by 700+ asset managers and allocators) is the most operationally focused portfolio monitoring tool in this list. It aggregates financial and operational data directly from portfolio companies, normalizes it to a consistent framework, and enables cross-portfolio KPI comparison within a single environment.
Where PitchBook and Capital IQ Pro help you benchmark against the external market, iLEVEL helps you benchmark across your own portfolio — identifying which companies are outperforming and which are lagging on KPIs like revenue growth, EBITDA margin, and working capital efficiency. It also integrates Cambridge Associates benchmarks and third-party data, so portfolio KPIs can be benchmarked against external indices as well.
| Attribute | Detail |
|---|---|
| Best For | Cross-portfolio KPI benchmarking, standardized financial data collection, PE-specific reporting |
| Key Features | Automated data ingestion from portfolio companies, customizable KPI frameworks, Cambridge Associates and third-party benchmarks, LP reporting templates, audit-ready dashboards |
| Pricing / Access | Enterprise subscription model; access via demo request through S&P Global |
The Hackett Group
The Hackett Group is an operational benchmarking provider that fills the gap every financial benchmarking tool leaves open. While PitchBook can show that a portfolio company's EBITDA margin is 400 basis points below sector peers, it cannot show which functions are responsible. The Hackett Group can.
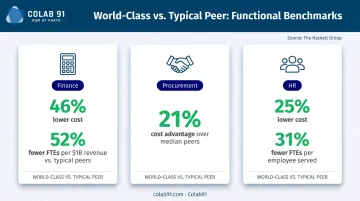
Its benchmarking covers finance, procurement, HR, IT, and supply chain — expressed as cost-per-unit metrics, headcount ratios, and efficiency scores versus best-in-class and peer-group medians. The numbers are specific:
- World-class finance functions operate at 46% lower cost and with 52% fewer FTEs per $1B revenue than typical peers
- World-class procurement carries a 21% cost advantage over median peers
- World-class HR runs at 25% lower cost and 31% fewer FTEs per employee served
For operating partners managing functional improvement programs, these numbers turn vague improvement targets into quantified benchmarks.
| Attribute | Detail |
|---|---|
| Best For | Operational benchmarking of finance, procurement, HR, and IT functions |
| Key Features | Process cost benchmarks, best-in-class performance metrics, functional efficiency scorecards, Quantum Leap platform, advisory support |
| Pricing / Access | Project-based or advisory subscription model; benchmarks typically take 7–10 weeks; contact Hackett directly for engagement scoping |
How We Chose the Best PE Benchmarking Data Tools
Evaluation Criteria
Tools were assessed on five factors:
- PE-specific relevance — designed for or widely adopted in PE workflows, not just general finance use
- Data depth and peer set granularity — ability to filter benchmarks by sector, stage, geography, and company size
- Coverage type — financial benchmarking vs. operational benchmarking vs. both
- Integration capability — compatibility with Excel, reporting workflows, and portfolio monitoring systems
- Value creation fit — whether outputs can be translated into actionable improvement initiatives, not just periodic data pulls
The Most Common Selection Mistake
PE teams frequently choose a single platform that covers financial benchmarks well and assume it handles operational gaps too. It does not. Financial benchmarks identify where a portfolio company is underperforming — operational benchmarks reveal why and what to fix.
A firm running PitchBook and Capital IQ Pro knows its portfolio company's EBITDA margin is 600 basis points below sector peers. It takes Hackett-level operational data to confirm that the gap is driven by finance function headcount running at 2x the world-class ratio and procurement costs sitting 15% above best-in-class. Those are actionable targets; the financial benchmark alone is not.
Firms that layer both categories consistently develop more targeted value creation plans.
The Analytics Bandwidth Factor
One selection criterion that often goes unexamined: does the firm have the internal capacity to act on benchmarking outputs? Sophisticated tools produce value only when someone translates their outputs into prioritized initiatives at the portfolio company level.
Dedicated analytics teams are a practical requirement for firms serious about acting on benchmarking data — not a luxury reserved for large-cap sponsors. Colab91 addresses this gap by building India-based analytics capability centers for PE sponsors and portfolio companies, covering spend intelligence, procurement KPI dashboards, savings opportunity assessments, and board-ready performance reporting throughout the hold period.
The firm's leadership previously scaled offshore analytics operations serving Carlyle Group, TPG, Elliott, and BC Partners through Impendi (acquired by Accenture). That experience directly shapes how Colab91 structures analytics teams for PE value creation workflows today.
Conclusion
The five tools covered here serve distinct and non-overlapping roles. PitchBook and S&P Capital IQ Pro are deal-team tools for financial peer benchmarking and transaction comps. Preqin provides fund-performance context for LP reporting and GP positioning. iLEVEL by S&P Global handles cross-portfolio KPI aggregation and monitoring. The Hackett Group diagnoses the functional cost gaps that financial benchmarks can only hint at.
Leading PE firms use these tools as a layered stack, not as substitutes for each other.
When selecting benchmarking tools, focus less on data coverage and more on workflow fit: can your team reliably translate the outputs into board-ready insights and specific improvement initiatives? The right tool is the one that actually changes decisions.
If analytics bandwidth is the bottleneck, Colab91 helps PE sponsors and portfolio companies build dedicated India-based analytics teams that put benchmarking data to work across:
- Spend analytics and savings opportunity assessments
- Procurement KPI dashboards and performance tracking
- Board-ready reporting and value creation documentation
Reach out at contact@colab91.com to explore how an offshore analytics capability center can accelerate your portfolio's performance improvement program.
Frequently Asked Questions
How do private equity firms manage portfolio companies?
PE firms manage portfolio companies through board oversight, operating partner engagement, value creation plans, and performance monitoring tools. Benchmarking data is used throughout the hold period to set targets, prioritize initiatives, and track progress against industry peers.
What is benchmarking in private equity, and why does it matter?
PE benchmarking compares a portfolio company's financial metrics (margins, growth, multiples) and operational metrics (cost ratios, process efficiency) against industry peers or best-in-class standards. The result: internal performance data gains external validation, making value creation plans credible and defensible to LPs and boards.
What metrics should PE firms benchmark across portfolio companies?
Key financial metrics include EBITDA margin, revenue growth CAGR, leverage ratio, and valuation multiples. Operational metrics include procurement spend as a percentage of revenue, SG&A as a percentage of revenue, finance headcount ratios, and working capital efficiency. The right mix depends on sector focus and hold stage.
How is financial benchmarking different from operational benchmarking?
Financial benchmarking compares top-line and bottom-line performance against peer companies using tools like PitchBook or Capital IQ Pro. Operational benchmarking evaluates the efficiency of specific business functions — procurement, finance, HR — against process-level standards using tools like The Hackett Group. Together, they pinpoint both the performance gap and the underlying cause.
What should PE firms look for when selecting a benchmarking data tool?
Prioritize data specificity (can it filter by sector, revenue band, and ownership type?), coverage type (financial vs. operational), integration with existing reporting workflows, and whether it was purpose-built for PE or adapted from general financial research.
Can benchmarking tools work for mid-market PE firms with smaller teams?
Yes — PitchBook and iLEVEL are used effectively by mid-market firms. The real constraint is analytics bandwidth. Smaller teams get more out of these platforms when they pair them with offshore analytics support — translating raw benchmarks into portfolio company guidance without stretching internal staff.