That blind spot has a name: tail spend. It sits at the bottom of the spend pyramid by dollar value but accounts for the majority of an organization's suppliers, transactions, and purchase orders. For mid-market and PE-backed companies-where procurement headcount is lean and bandwidth goes to strategic initiatives-this fragmented spend often goes entirely unmanaged.
The cost of that neglect adds up fast. According to BCG, digital tail spend management can cut annual expenditures by 5%–10% on average, with 30% of companies in a Hackett study saving at least 10%. That's not a rounding error-it's a material P&L opportunity hiding in plain sight.
This guide explains what tail spend analysis is, why it matters, how to run one step by step, and how to turn findings into sustained savings.
Key Takeaways
- Tail spend = the high-volume, low-value purchases that make up roughly 80% of transactions but only 20% of total spend
- Left unmanaged, it drives supplier fragmentation, maverick buying, and hidden processing costs that compound quietly across the business
- Tail spend analysis identifies, categorizes, and prioritizes this spend to uncover savings and reduce complexity
- A structured six-step process-from data consolidation to KPI tracking-turns raw spend data into concrete savings opportunities
- Skilled analysts and clear governance processes deliver results that technology alone cannot
What Is Tail Spend Analysis?
Tail spend analysis is the systematic process of examining an organization's low-value, high-volume purchases to understand where money is going, identify inefficiencies, and surface consolidation or savings opportunities. It's distinct from strategic spend management, which focuses on the high-value categories that procurement teams typically prioritize.
The Pareto Principle in Procurement
The 80/20 rule is the standard framing: roughly 20% of suppliers account for 80% of spend. ISM notes this benchmark is oversimplified-in practice, as few as 7.4% of active suppliers accounted for 80% of sourceable spend in late 2021. A very small number of strategic suppliers capture most of the dollar value, while the long tail of hundreds of smaller vendors accounts for the bulk of transactions, invoices, and administrative burden.
Three related terms often get conflated:
- Tail spend - low-value, high-volume purchases, regardless of how they were made
- Maverick spend - purchases made outside approved procurement channels or contracts (a compliance issue)
- Spot buying - unplanned, one-off purchases, often in tail categories but not necessarily off-contract
Tail spend can be perfectly compliant. Maverick spend is a control failure. The two overlap, but they're not the same.
Reactive vs. Proactive Approaches
Most organizations start with a reactive approach: a periodic audit of accumulated spend data, usually triggered by a cost initiative or procurement review. It establishes a baseline and surfaces patterns that weren't visible before.
Proactive analysis involves ongoing monitoring with defined thresholds, categories, and triggers-closer to a continuous discipline than a one-time project. For mid-market companies with limited procurement resources, starting reactive and building toward proactive is the realistic path.
Why Tail Spend Analysis Matters for Procurement Performance
The math on unmanaged tail spend is more punishing than most teams realize-and the cost isn't limited to prices paid.
The Transaction Cost Problem
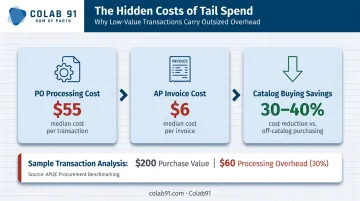
Every purchase order carries processing overhead. APQC's benchmarking data puts the median cost to process a single PO at $55.00, based on a sample of 4,625 companies. Processing an AP invoice adds another $6.00 at the median.
Now apply that to tail spend: hundreds of low-value transactions, many for amounts under $500, each generating a PO and an invoice. A $200 purchase from an ad hoc vendor might cost $60 just to process. The tail spend itself isn't the only problem. The administrative machinery around it compounds the waste.
Purchasing catalogs and automated buying channels can reduce transaction costs by 30%–40% per transaction, which is exactly why channeling tail spend into pre-approved catalogs is one of the highest-ROI levers in tail spend management.
Supplier Base Fragmentation
Tail spend analysis almost always reveals a supplier base that has grown without structure or governance. One BCG scenario analysis found that a manufacturer with 200 suppliers needed only 27 to cover all line items in a typical tender. The rest were redundant, adding contract maintenance, onboarding, and payment overhead without adding value.
Consolidating tail suppliers into fewer preferred relationships unlocks:
- Volume leverage for better pricing
- Reduced vendor onboarding and maintenance costs
- Faster, more predictable sourcing for recurring needs
Compliance and Maverick Spend Risk
Unmanaged tail spend is where maverick buying tends to concentrate. APQC found that bottom-performing organizations have maverick purchasing rates of 2.5% or more of total purchases-and that organizations with 2% or more maverick buying spend $2.58 more per $1,000 in purchases and take 16 more median hours to issue a PO compared to organizations below 1%.
For companies in regulated industries, healthcare in particular, off-contract buying in tail categories creates audit exposure and inconsistent supplier quality at exactly the point where governance is hardest to enforce. Colab91 advisor Erika Jung, a former CPO who led procurement transformation at Pediatric Associates (a TPG portfolio company), has worked through these compliance dynamics firsthand with healthcare clients.
The Strategic Focus Dividend
Addressing these risks has a compounding benefit: when tail spend is systematized and partially automated, procurement teams recover bandwidth. For lean mid-market procurement functions, that's not a minor benefit-it's the difference between having capacity for a strategic sourcing event or not.
How to Perform Tail Spend Analysis: Step by Step
Most tail spend analyses fail not because of missing data, but because of skipped steps-particularly the failure to cleanse data before drawing conclusions, or acting on findings without a clear prioritization framework.
Step 1 – Define Scope and Set Thresholds
Before touching any data, decide what "tail spend" means in your organization:
- Set a dollar threshold (for example, transactions or suppliers below $10K annually)
- Identify which systems, departments, and business units are in scope
- Get stakeholder alignment on definitions before analysis begins
Skipping this step produces an analysis that different teams interpret differently, with no clear owner for the resulting action plan.
Step 2 – Consolidate and Cleanse Spend Data
Pull data from every relevant source: ERP, P-cards, expense systems, AP records. Then normalize it. ISM identifies this as the foundational requirement for spend analysis. The cleansing work covers three areas:
- Supplier normalization (deduplicating vendor names and IDs)
- Translation of transactional text into readable descriptions
- Classification against a formal procurement taxonomy
In practice, this step surfaces surprises immediately. Duplicate supplier entries - think "Staples Inc." and "Staples Office Supply" as separate vendors - mask true spend concentration and distort consolidation targets. Get this wrong, and every insight downstream is built on a flawed foundation.
Step 3 – Classify and Categorize Tail Spend
Map spend to standardized categories-MRO, office supplies, IT peripherals, professional services, travel, facilities maintenance. Classification frameworks like UNSPSC provide a consistent taxonomy if you don't already have one.
Also flag:
- Off-contract purchases
- Direct vs. indirect tail spend
- Categories with the highest supplier counts relative to spend
Without this structure, clean data still can't tell you where to act first.
Step 4 – Identify Patterns and Opportunity Areas
With cleansed, categorized data, surface the findings that drive action:
- Which suppliers appear disproportionately often?
- Where is off-contract buying most concentrated?
- Which categories have multiple overlapping suppliers for similar goods?
- Where could automation or catalog buying reduce transaction costs?
The goal isn't an exhaustive audit. Focus on the 3–5 highest-value opportunities that need immediate attention.
Step 5 – Prioritize and Execute Actions
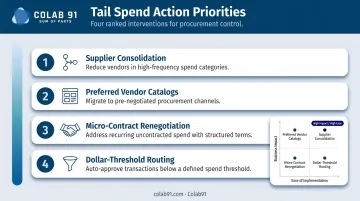
Rank opportunities by two dimensions: financial impact and ease of implementation. Typical actions include:
- Supplier consolidation - reduce vendors in high-frequency, low-value categories
- Preferred vendor catalogs - migrate repeat purchases to pre-negotiated channels
- Micro-contract renegotiation - address suppliers with recurring but uncontracted spend
- Dollar-threshold routing - auto-approve purchases below a set threshold through approved channels
Prioritize quick wins that generate savings and build organizational confidence in the process.
Step 6 – Monitor KPIs and Iterate
Define and track clear metrics after implementation:
| KPI | What It Measures |
|---|---|
| Cost savings vs. benchmark | Actual price improvement against pre-consolidation baseline |
| Active supplier count | Progress on rationalization |
| % of tail spend under managed channels | Coverage and compliance improvement |
| Maverick spend as % of total | Control and policy adherence |
Conduct quarterly reviews to refine thresholds and capture new tail spend that emerges after M&A activity, new vendor onboarding, or budget resets.
Tail Spend Analysis in Practice: A Real-World Walkthrough
Consider a mid-market services company with roughly 400 active suppliers. A routine procurement review reveals that 310 of those suppliers collectively account for less than 18% of total spend - a long-tail distribution that went unaddressed because the team was focused on managing the top 90 strategic relationships.
Here's how the walkthrough unfolds across four steps:
1. Data Consolidation The team pulls AP invoices, P-card data, and expense reports into a single spreadsheet. First surprise: 60+ duplicate or near-duplicate supplier entries. "Staples Inc." and "Staples Office Supply" appear as separate vendors, masking true spend concentration. Skipping this cleansing step would have produced misleading targets from the start.
2. Categorization The cleansed spend maps into six buckets. MRO, IT peripherals, and facilities maintenance together account for 70% of tail suppliers but only 12% of total spend - and most purchases in these categories were made at list prices without contracts.
3. Opportunity Identification Three specific actions surface:
- Consolidate MRO purchases to two preferred distributors - McKinsey's research on digital MRO procurement benchmarks supplier consolidation at 15%–20% cost savings in MRO categories
- Migrate IT peripheral purchases to a single pre-negotiated catalog
- Set a $500 threshold below which purchases auto-route to approved channels
4. Results at 90 Days Supplier count drops from 310 to approximately 180. Off-contract purchasing rates fall measurably. More telling: the procurement team now has capacity to run two strategic sourcing events on higher-value categories - a capacity unlock that compounds the direct savings over time.

How Colab91 Can Help
For mid-market and PE-backed organizations, the bottleneck isn't usually data access or analytical methodology-it's bandwidth. Running a rigorous tail spend analysis while managing strategic sourcing, supplier relationships, and daily procurement operations is a resource problem as much as a capability problem.
Colab91 was built around this problem. The company builds dedicated India-based procurement analytics teams that function as an extension of the client's procurement function-not a project team that delivers a report and leaves, but embedded practitioners with deep domain expertise in sourcing and spend analytics.
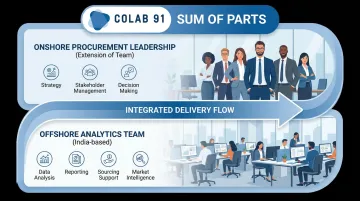
The "Sum of Parts" model divides the work deliberately:
- Offshore analysts handle data-intensive tasks - consolidation, cleansing, classification, opportunity identification
- Onshore procurement leaders focus on strategic decisions, stakeholder management, and supplier relationships
Analytical throughput goes up. Strategic focus improves.
For PE sponsors and their portfolio companies, this fits the value creation timeline. A dedicated spend analytics function in India can be stood up faster and at a fraction of the cost of equivalent onshore capability - with domain expertise embedded from day one, not recruited and trained over 12 months.
Colab91's leadership team has built this model before. Managing Partners Madhur Kabra and Vijender Kapoor previously led Impendi's India operations (later acquired by Accenture), scaling a multifunctional organization to 100+ practitioners serving Carlyle Group, TPG, Elliott, and BC Partners.
Advisor Erika Jung brings CPO-level experience from healthcare procurement, including enterprise-wide cost transformation at Pediatric Associates, a TPG portfolio company.
For organizations where tail spend analysis has been perpetually deprioritized, this is how it finally gets done.
Conclusion
Tail spend analysis isn't a one-time project-it's a discipline that compounds over time. Cleaner data makes the next analysis faster. A rationalized supplier base makes governance easier. Freed-up procurement bandwidth creates capacity for strategic work that generates further savings.
The barrier to starting is lower than most teams assume. Three steps get the process moving:
- Define what tail spend means in your organization (spend threshold, categories, vendor count)
- Consolidate data from ERP, P-cards, and AP into a single view
- Let the patterns surface - opportunities in maverick spend and supplier overlap become visible quickly
From there, the real work is execution. BCG research consistently shows tail spend savings are achievable - the limiting factor is rarely the data, it's having the analytical bandwidth to act on it. That's where dedicated procurement analytics teams, whether built in-house or through an offshore capability center, make the difference between insight and results.
Frequently Asked Questions
What is tail spend analysis?
Tail spend analysis is the process of identifying, categorizing, and examining an organization's low-value, high-volume purchases to uncover hidden costs, compliance risks, and consolidation opportunities. It targets the long tail of suppliers and transactions that strategic procurement efforts typically overlook.
How do you calculate tail spend?
Start by ranking all suppliers or transactions by total spend value. The long tail is typically the bottom 20% of spend, which tends to involve 80% of suppliers and transactions. Segment further by applying a dollar threshold (for example, all suppliers below $25K annually) or by transaction count.
What is an example of tail spend?
One-off office supply orders, ad hoc IT peripheral purchases, single-use maintenance vendor invoices, and low-value consulting engagements all qualify. Each transaction is minor individually, but collectively they represent a significant volume of POs, invoices, and administrative overhead.
What is the 80/20 rule in spend analysis?
The Pareto Principle holds that roughly 80% of total spend concentrates among 20% of suppliers, while the remaining 80% of suppliers account for only 20% of spend. This is a useful heuristic, not a universal benchmark-in practice, even fewer strategic suppliers may drive the majority of spend.
What is the difference between tail spend and maverick spend?
Tail spend refers to low-value, high-volume purchases by category, regardless of whether they followed approved processes. Maverick spend refers specifically to purchases made outside approved channels or contracts-a control failure. The two overlap in practice but are distinct problems.
Can tail spend analysis be done without enterprise procurement software?
Yes. Most organizations start by extracting data from existing ERP and AP systems into a structured spreadsheet. The critical success factor isn't the tool-it's having skilled analysts who can cleanse, categorize, and interpret the data. Purpose-built software adds scale and speed, but isn't required to get started.