Introduction
Holding periods are compressing. Entry multiples remain stubbornly high. And organic revenue growth alone rarely closes the gap between what a PE firm pays and what it needs to return to LPs.
That pressure is pushing the best value-creation teams toward the cost base — specifically procurement. According to McKinsey, external spend typically accounts for 50% to 80% of a company's total cost base. In manufacturing, Kearney puts third-party spend at roughly 50% of revenue.
Even modest improvements on a number that large translate directly into EBITDA — no market tailwinds, M&A timing, or customer behavior required.
The problem is execution. Most portfolio companies at acquisition lack the data infrastructure to surface procurement insights quickly. Common gaps include:
- Spend fragmented across disconnected ERP systems
- Categories unclassified and uncleaned
- Supplier relationships unmanaged and untracked
Procurement analytics is what converts that fragmented data into a structured savings roadmap. This post covers exactly how it works, which levers it activates, and when in the deal lifecycle PE firms need to move.
Key Takeaways
- Procurement spend represents 50–80% of a typical company's cost base, making it the largest single EBITDA lever PE value-creation teams can pull
- Analytics must start before or at deal close — every quarter of delay compounds lost savings across the hold period
- Cross-portfolio spend consolidation can double the savings achievable by any single portfolio company acting alone
- Governance determines whether identified savings actually hit the P&L — track realized vs. committed savings from day one
- Offshore analytics delivery cuts cost-per-insight, making a continuous program economically viable for mid-market portfolios
Why Procurement Spend Is the Biggest EBITDA Lever in Any PE Portfolio
The Math That Makes the Case
Most portfolio company management teams lack a unified view of what they're spending, with whom, or at what prices. That data gap is where the value creation opportunity lives — and it's larger than most operating partners expect.
Consider a straightforward example: a portfolio company with $300M in revenue, $30M in EBITDA, and $180M in total procurement spend. If even 60% of that spend is addressable, the firm is working with a $108M optimization target. Delivering 8–12% savings on that base — a range consistent with industry benchmarks for structured sourcing programs — produces $8.6M to $13M in annual savings. At a 10x EBITDA multiple, that's $86M to $130M in incremental enterprise value from procurement alone.
McKinsey found that procurement typically delivers more than 20% of total financial impact in PE-driven transformations — more than revenue growth initiatives or M&A roll-ups in the same period.
Procurement vs. Other Value-Creation Levers
| Lever | Speed to EBITDA | Certainty | Market Dependency |
|---|---|---|---|
| Procurement savings | Fast (90–180 days) | High | None |
| Revenue growth | Slow (12–24 months) | Medium | High |
| M&A roll-up | Slow (18–36 months) | Low | High |
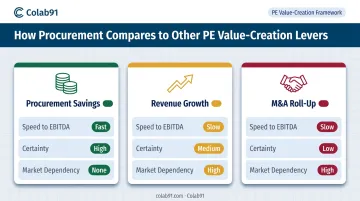
Procurement savings are faster and more predictable than any other lever. They don't depend on customer acquisition, competitor behavior, or deal flow timing.
The Compounding Effect
That speed advantage becomes a compounding asset across the hold period. Savings captured early don't just improve one year's EBITDA — they stack.
- A $10M annual saving captured at close contributes four to five years of trailing EBITDA improvement by exit
- McKinsey's research on indirect sourcing programs found 80% of savings are captured in the first 12 to 24 months
This is why timing matters as much as magnitude. A firm that initiates procurement analytics in year one of a five-year hold extracts multiples more value than one that starts in year three.
What Procurement Analytics Actually Does in a Portfolio Company
Procurement analytics is not ERP reporting. It's the systematic collection, cleansing, categorization, and analysis of spend data — specifically designed to identify savings opportunities, compliance gaps, and sourcing levers that don't appear in standard financial reporting.
Spend Visibility and Categorization
Most portfolio companies at acquisition have transactional spend scattered across multiple ERP systems, cost centers, and business units. The first task is building a unified spend cube — typically covering 12 to 24 months of accounts payable data — cleansed and classified against a structured taxonomy (UNSPSC-based or a custom framework for the portfolio).
Colab91's AI-powered platform automates this step: raw AP data is ingested, cleansed, classified, and tagged with supplier diversity, ESG, risk, and contract term data. The output is a spend cube that enables analysis across any dimension — category, supplier, site, business unit, or contract status.
What actionable visibility looks like in practice:
- Category-level spend maps showing total addressable spend by subcategory
- Supplier consolidation ratios across sites and business units
- Tail spend exposure — typically 20% of spend spread across 80% of suppliers, per CIPS benchmarks
- Price variance analysis flagging where the same item is bought at different prices across locations
Supplier and Contract Analytics
Analytics surfaces supplier fragmentation quickly: the same category of goods being purchased from 12 different vendors across different sites, at different prices. That fragmentation creates an immediate consolidation and negotiation opportunity. Kearney's cross-portfolio PE research found approximately 6% savings potential through supplier consolidation and renegotiation alone.
Once fragmentation is mapped, contract compliance analytics surfaces a separate problem: contract leakage — the gap between negotiated prices and what's actually being invoiced. This leakage is recoverable without any new negotiations. Quantifying it requires analytics; most portfolio companies have no visibility into this gap at all.
Market and Benchmark Analytics
With internal gaps identified, the next question is external: how does this company's pricing compare to the market? Benchmark analytics compares unit prices against market rates or cross-portfolio averages, producing a "should-cost" view by category. This tells you not just what you're spending, but what you should be spending — and how large the gap to market is.
Four Analytics-Driven Levers PE Firms Pull to Maximize Returns
Spend analytics doesn't create value by itself. It generates the intelligence that enables four specific actions. Each lever requires the data foundation that analytics provides.
Strategic Sourcing Acceleration
With a clean spend cube in hand, a procurement team knows total category spend, current supplier mix, price benchmarks, and contract expiry dates. That precision changes how sourcing events are run — instead of broad, time-consuming RFP processes, teams run targeted sourcing events against specific suppliers in specific categories.
Kearney found that coordinated procurement organizations execute category strategies at 67% velocity versus 52% for uncoordinated peers. AI-enabled normalization compresses what used to take months of manual effort into weeks. Savings start faster, and the window for realizing them within a hold period widens.
Demand Management and Specification Optimization
This lever works before suppliers are even contacted. Spend and consumption data reveals where a portfolio company is:
- Buying more than it consumes
- Using premium specifications where standard would suffice
- Allowing maverick spending outside approval workflows
Demand management typically delivers 5–15% savings on addressable spend without changing a single supplier. It's the fastest lever when the data exists to quantify it.
Supplier Consolidation and Cross-Portfolio Leverage
When analytics shows 12 vendors supplying the same category across different sites, the consolidation opportunity is immediate. Volume concentration generates negotiating leverage that fragmented buying simply can't achieve.
For PE firms, this lever operates at two distinct levels:
- Within a single portfolio company — consolidating redundant vendors across sites and business units
- Across the portfolio — pooling collective spend to access terms no individual company could negotiate alone
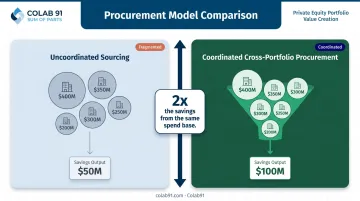
A group of portfolio companies collectively spending $50M on IT services is a fundamentally different buyer than any one of them individually. The same Kearney research puts the savings gap in concrete terms: coordinated procurement generates roughly $100M in annual savings on a $2B spend base versus $50M for uncoordinated initiatives — double the value from the same spend.
Contract Governance and Savings Tracking
Negotiated savings that aren't tracked don't stay realized. Once pricing is renegotiated, procurement analytics dashboards track:
- Actual purchase prices against contracted rates
- Non-compliant purchases flagged by supplier and category
- Realized savings versus identified savings targets reported to the PE operating partner
The compliance gap is measurable and material: coordinated procurement organizations maintain 87% savings compliance versus 76% for uncoordinated peers, per Kearney. That 11-point difference is EBITDA that erodes quietly when governance infrastructure isn't in place.
Colab91's analytics programs deliver this through weekly and monthly procurement intelligence packages — including board-ready savings tracking reports — so operating partners have continuous, auditable savings validation throughout the hold period.
From Due Diligence to Exit: Timing the Analytics Program
Pre-Deal: What to Assess Before Close
Commercial due diligence is the right time for a procurement read. Key signals to assess:
- Spend data availability — Can the target provide 12–24 months of AP transaction data?
- ERP landscape — How many systems? Are they integrated?
- Procurement organizational maturity — Is there a CPO? A category management function?
- Category-level risk flags — Single-source suppliers, expiring contracts, concentrated spend
A procurement diagnostic completed before deal close means the 100-day plan starts on day one rather than month three. Bain's research on PE-backed companies shows that those with pre-acquisition action planning in place have management executing against stretch targets within the first month post-close.
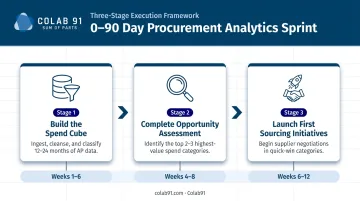
0–90 Days: The Sprint That Matters Most
The first 90 days should accomplish three things:
- Build the spend cube — Ingest 12–24 months of AP data, cleanse, classify, and enrich
- Complete the opportunity assessment — Identify the two to three highest-value categories for immediate action
- Launch first sourcing initiatives — Begin supplier negotiations in quick-win categories
Colab91's Savings Opportunity Assessment delivers this in four to six weeks, identifying 5–15% of addressable spend as quantifiable savings with a category-by-category attack plan. Kearney confirms that sponsors using AI-enabled analytics can achieve run-rate savings within the first 90 to 180 days of ownership.
Every month of delay in the first year is savings lost — and in a five-year hold, that math compounds quickly.
Ongoing Governance: Sustaining Savings Through Exit
The diagnostic phase produces a savings roadmap. Sustaining those savings requires embedding analytics into operating rhythm:
- Quarterly spend reviews by category
- Savings dashboards tracking realized versus identified savings
- Annual re-benchmarking against market rates
- Contract renewal calendars with advance notification triggers
Without this infrastructure, initial savings erode. Firms that skip ongoing governance often see 20–30% of identified savings reverse before the trailing EBITDA window closes — precisely when clean numbers matter most to a buyer.
Cross-Portfolio Analytics: The Multiplier Effect Most PE Firms Miss
When a PE firm aggregates spend data across multiple portfolio companies in the same category, it unlocks negotiating leverage that no individual company could access on its own. A portfolio of five mid-market companies collectively spending $30M on telecom or professional services can negotiate group terms. Standalone, each company negotiates from a position of $4–8M — a fundamentally different conversation.
According to Kearney's procurement benchmarking research, coordinated cross-portfolio procurement generates approximately twice the savings of uncoordinated single-entity sourcing on the same spend base.
Group consolidation isn't always feasible — sector differences, geography, and competitive concerns can rule it out. But benchmarking across the portfolio still delivers real value in those cases.
If Portfolio Company A is paying 30% more for IT services than Portfolio Company B in the same region, that gap is an internally validated improvement target. No external data required — just visibility that most PE firms don't have.
Colab91 runs portfolio-wide procurement diagnostics for PE sponsors, covering:
- IT and SaaS spend
- Telecom and connectivity
- Professional services
- Marketing and agency spend
For sponsors like Carlyle Group, TPG, Elliott, and BC Partners, this cross-portfolio view creates a benchmarking capability that individual portfolio management teams don't have the data or bandwidth to build on their own.
Building Scalable Procurement Analytics Capacity
The Build vs. Buy vs. Offshore Decision
Large-cap PE firms often embed operating partners or build centralized procurement centers of excellence. For mid-market portfolios, hiring an equivalent onshore analytics team is rarely cost-effective for a single portfolio company's spend base.
The offshore delivery model changes that equation. India's GCC ecosystem now includes more than 1,700 centers generating $64.6B in revenue, employing nearly 2 million professionals — with analytics and AI capability that EY reports 92% of GCC leaders now describe as generating strategic value well beyond cost savings — spanning AI, advanced analytics, and domain-specific capability.
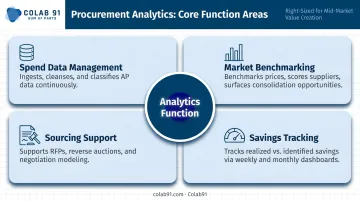
What a Right-Sized Procurement Analytics Function Looks Like
For a mid-market portfolio company, the core analytics function typically spans four areas:
- Ingests, cleanses, and classifies AP data on an ongoing basis (spend data management)
- Benchmarks category prices, scores supplier performance, and surfaces consolidation opportunities
- Supports RFP processes, reverse auctions, and negotiation modeling
- Tracks realized vs. identified savings through weekly and monthly dashboards
That functional scope is what makes the offshore-augmented model practical. A lean onshore procurement lead handles stakeholder management, supplier relationships, and final decision-making — while a dedicated offshore analytics team absorbs the data-intensive work at a fraction of onshore cost.
Colab91 builds and operates these teams across three engagement models — dedicated team, build-operate-transfer, or managed operations — depending on how much long-term ownership the PE firm wants to retain. The leadership team previously scaled a 100+ person offshore procurement analytics organization at Impendi (acquired by Accenture), serving Carlyle, TPG, Elliott, and BC Partners. That same model now applies to mid-market portfolio companies.
Frequently Asked Questions
How do you measure cost savings in procurement?
The two standard measures are identified savings (the gap between current spend and new contracted price) and realized savings (the actual reduction reflected in the P&L once purchases are made under the new contract). PE firms track both because the gap between them — savings leakage — is itself a key performance metric indicating whether negotiated terms are being honored in practice.
What is spend analytics in private equity?
Spend analytics aggregates, cleanses, and categorizes a portfolio company's transactional purchasing data to produce a structured view of who buys what, from which suppliers, and at what prices. This spend cube is the foundational input for every sourcing initiative, supplier negotiation, and savings tracking program across the hold period.
How quickly can procurement analytics drive EBITDA improvement in a portfolio company?
An initial spend analysis and opportunity assessment typically takes four to six weeks. Early-action sourcing initiatives in high-spend categories can begin generating savings within the first 90 days post-close. A full savings program addressing the majority of addressable spend generally produces measurable EBITDA results within the first 12 months.
What procurement data should PE firms analyze during due diligence?
The core inputs are 12–24 months of accounts payable transaction data, existing supplier contracts and expiry dates, an ERP system inventory, and any existing category strategies. The goal is to size the savings opportunity and surface data quality risks before close — giving the 100-day plan a running start.
How do PE firms scale procurement analytics across multiple portfolio companies?
Scaling requires three things: a standardized data taxonomy applied consistently across the portfolio, a centralized analytics function at the fund or capability-partner level, and a uniform savings-tracking framework. Without taxonomy consistency, cross-portfolio benchmarking breaks down — operating partners end up comparing companies on different definitions of savings, making performance data unreliable.
What is the difference between direct and indirect spend analytics?
Direct spend covers inputs that go into a company's product or service — typically tightly managed. Indirect spend covers everything else: IT, facilities, professional services, logistics, marketing. In most mid-market portfolio companies, indirect spend analytics yields the fastest initial savings because it's the most overlooked and the least likely to have an active category management structure in place.