Introduction
Most procurement leaders at mid-market and PE-backed companies are sitting on a data problem they can't fully see. Spend data lives across ERPs, P2P platforms, supplier portals, and card systems - inconsistent formats, supplier names spelled five different ways, line items labeled simply as "services."
Manual categorization can't keep pace with that volume. Periodic reporting lags too far behind actual decisions.
According to Ardent Partners' 2024 AP benchmarking research, 49.7% of invoices still arrive via manual channels - paper, fax, PDF, or email - with an average invoice exception rate of 20.7%. That's the raw material feeding most spend analytics processes.
Machine learning changes the math. It automates the labor-intensive steps - cleaning, classifying, flagging anomalies - and turns scattered transaction data into a continuous, accurate picture of where money is going. For mid-market and PE-backed organizations especially, that shift from periodic snapshots to real-time intelligence is where the real value compounds.
This article covers the core ML applications in spend analytics, how the end-to-end pipeline works, what business outcomes it drives, and what implementation actually requires at scale.
TLDR: Key Takeaways
- ML automates data cleaning, classification, and anomaly detection - reducing cycle time from weeks to real-time
- Accurate categorization reveals tail spend blind spots and fragmented supplier relationships that manual processes miss
- Predictive analytics shifts procurement from backward-looking reporting to forward-looking decision support
- Talent, not technology, is the biggest implementation gap - organizations need analysts who can train models, validate outputs, and act on the insights
- Mid-market and PE-backed firms can access these capabilities through dedicated offshore analytics teams - no expensive onshore build-out required
Why Traditional Spend Analytics Falls Short
The problem starts with the data itself.
Spend data enters procurement workflows through fragmented, exception-heavy channels. Supplier names are inconsistent across systems. Cost codes are missing or wrong. Invoice descriptions like "professional services" or "miscellaneous" are too vague to classify meaningfully.
When every data source has its own format and quality standard, any analysis built on top of it inherits those flaws.
Manual cleaning compounds the issue. Analysts spend weeks normalizing data before they can do anything useful with it - and by the time a taxonomy exercise is complete, it's already months out of date. That lag leaves procurement teams with stale visibility and blind spots in tail spend.
The strategic consequences are significant:
- Fragmented supplier bases go unrationalized, hiding consolidation opportunities
- Teams respond to sourcing problems rather than anticipating them, without continuous visibility
- Missing benchmark data weakens the negotiation table
- Procurement can't demonstrate savings or spend under management to PE sponsors with confidence
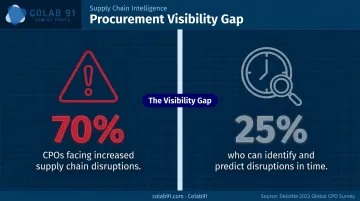
Deloitte's 2023 Global CPO Survey found that 70% of procurement leaders reported increased supply-chain disruptions, yet only 25% could identify and predict those disruptions in a timely manner. That gap isn't a strategy failure - it's a data and analytics failure.
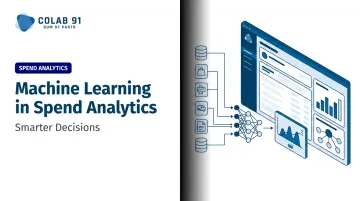
How Machine Learning Works in Spend Analytics: Core Applications
Automated Spend Classification
Supervised ML models learn from labeled historical transactions, then automatically map new spend to the correct category in a taxonomy hierarchy: Technology → Cloud Infrastructure → specific vendor, for instance. The result is high-coverage classification at scale, without analysts manually reviewing every transaction.
What makes this more powerful than rule-based systems: the model improves continuously. As analysts correct misclassifications, that feedback retrains the model. Peer-reviewed research on UNSPSC classification found 93% accuracy on train-test evaluation and 92% on k-fold cross-validation, confirming ML classification performs in real procurement datasets, not just controlled experiments.
Anomaly Detection and Fraud Flagging
ML identifies spend that deviates from expected patterns: unusually large invoices, duplicate payments, purchases outside contract terms. These are flagged automatically, not caught weeks later in a periodic audit.
Detection typically runs on two layers:
- Real-time flags at data entry - catching errors before they enter the system
- Retrospective scanning across historical transactions - surfacing problems that already occurred
This matters financially. Ardent Partners' 2024 survey of 212 AP and finance leaders found 34% reported a business payment fraud attack in the prior year, with 37% saying fraud attacks increased year-over-year. APQC data shows bottom-performing organizations have only 88% error-free disbursements - meaning 12 out of every 100 payments contain errors or are late.
Supplier Segmentation and Performance Scoring
Both supervised and unsupervised ML algorithms can cluster suppliers into meaningful segments based on spend volume, delivery reliability, risk profile, and compliance behavior, replacing manual scoring that's slow, subjective, and inconsistent.
For PE-backed companies rationalizing supplier bases post-acquisition, ML-powered segmentation cuts through weeks of manual analysis. It surfaces which relationships to develop, renegotiate, or exit before the window to act closes.
McKinsey documented a relevant example: advanced analytics identified a single broker applying markups across 400 vendors, a leak manual review had overlooked completely.
Predictive Spend Forecasting
ML models trained on historical spend patterns can forecast future category-level spend, helping finance and procurement teams plan budgets, anticipate cost pressures, and model the impact of sourcing decisions before they're made. For PE-backed organizations where procurement must demonstrate ROI, this shifts forecasting from reactive to evidence-based.
Hackett Group's 2024 research projected adoption of modeling and intelligence technologies growing 14% year-over-year, reflecting how quickly forward-looking analytics is moving from a competitive differentiator to a baseline expectation.
KPI Benchmarking and Opportunity Identification
ML tools can analyze internal KPIs (spend under management, contract compliance rates, payment terms) alongside external benchmark data to surface specific negotiation opportunities. Knowing that peers in your category achieve better payment terms or lower unit prices is a direct lever for renegotiation. Manual analysis rarely produces that comparison fast enough to act on it - which is precisely where ML earns its place in the procurement stack.
From Data Chaos to Strategic Clarity: The ML-Driven Analytics Pipeline
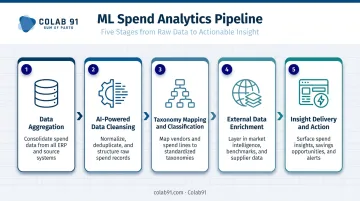
A well-designed ML pipeline follows five stages, each building on the one before it.
Data Aggregation - Pull spend data from all source systems: ERPs, P2P platforms, procurement tools, card data. Completeness matters. Missing data from even one business unit creates blind spots that undermine every downstream analysis.
AI-Powered Data Cleansing - NLP techniques handle the messiest part: normalizing supplier names, correcting description errors, merging duplicate entries, standardizing currencies and units. The payoff is measurable. Ardent Partners benchmarks show best-in-class AP organizations process invoices in 3.1 days at $2.78 per invoice, versus 9.15 days and $9.40 for average organizations - automation and data quality drive that gap.
Taxonomy Mapping and Classification - Cleaned transactions are mapped to a structured spend taxonomy - industry-standard frameworks like UNSPSC, or custom hierarchies. ML achieves high initial accuracy; human validation closes the remaining gap and feeds the model for future improvement. Classification works best as a continuous process, not a one-time exercise.
Enrichment with External Data - Internal spend data becomes far more actionable when layered with external intelligence: market price indices, supplier risk scores, ESG ratings, and peer benchmarks. This is what transforms a spend ledger into a strategic asset - giving you context for whether your spend is competitive, not just what it is.
Insight Delivery and Action - Modern platforms surface insights through dashboards, automated alerts, and increasingly through natural language interfaces. The best systems don't just show data - they prioritize opportunities by business impact and support direct actions: initiating a negotiation, flagging a compliance issue, or escalating a supplier risk signal.
Business Outcomes: What ML-Powered Spend Analytics Actually Delivers
Cost Savings Through Better Visibility
Accurate category visibility reveals where spend is fragmented across too many suppliers. Consolidation creates leverage. McKinsey's research on advanced procurement analytics found that statistical models and analytics can deliver 3% to 8% cost savings over traditional pricing approaches - with one manufacturer achieving an 8% reduction in cluster prices within the first month of implementation.
Faster Insight Cycles
Consider what happens when a supply chain disruption hits and your last spend report is six weeks old. ML-powered pipelines deliver continuous, near real-time visibility - so sourcing decisions land while the window is still open, not after it's closed.
Reduced Tail Spend Leakage
Tail spend - the long tail of low-value, high-volume transactions - is typically unmanaged and invisible. ML automatically classifies maverick spend and off-contract purchases, surfacing leakage that manual processes never catch. This is often where the first measurable ROI appears after implementation.
Proactive Supplier Risk Management
Continuous ML monitoring of supplier behavior - payment patterns, delivery performance, spend concentration - enables earlier intervention. For PE portfolio companies running lean procurement teams, this is particularly valuable.
Deloitte data makes the stakes concrete: 70% of CPOs face increased supply-chain disruptions, but only 25% can predict them in time to act. Earlier signals change that ratio.
Stronger Negotiation Leverage
Combining internal spend data with external benchmarks gives procurement teams hard evidence. Knowing that industry peers achieve better payment terms or lower prices in a specific category changes the dynamics of a negotiation.
ML surfaces that intelligence fast enough to actually use it - before the negotiation is already underway.
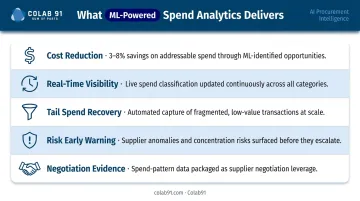
At a glance - what ML-powered spend analytics delivers:
- Cost reduction: 3–8% savings through consolidated category management and data-driven sourcing
- Real-time visibility: Continuous pipelines replace stale weekly or monthly reports
- Tail spend recovery: Automatic classification catches maverick and off-contract spend early
- Risk early warning: Behavioral monitoring flags supplier issues before they escalate
- Negotiation evidence: Benchmark-backed data shifts leverage at the table
Building the Right Team to Scale ML in Spend Analytics
ML tools don't run themselves. The technology is only as good as the analysts who define taxonomies, validate classifications, interpret outputs, and translate insights into sourcing action. Many mid-market companies underinvest in this layer - which is why implementations stall or deliver limited ROI.
A capable spend analytics team typically needs:
- Data analysts who understand procurement taxonomies and can validate ML classifications
- Category managers who contextualize outputs and turn insights into negotiation strategies
- Data engineers who maintain the pipeline and manage integrations
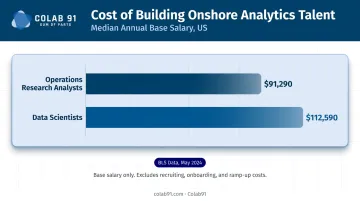
Building this onshore is expensive. BLS data from May 2024 puts the US median annual wage for operations research analysts at $91,290 and data scientists at $112,590. For mid-market companies, assembling even a small team at those rates - before accounting for recruiting timelines and ramp-up - quickly becomes a barrier.
That cost gap is exactly what drove the founding of Colab91. The team spent two decades building and scaling offshore analytics capability centers - including growing Impendi's India operations to 100+ practitioners serving PE sponsors like Carlyle Group, TPG, Elliott, and BC Partners. That track record in procurement analytics and offshore delivery is what Colab91 brings to mid-market and PE-backed companies today.
The model pairs procurement domain expertise with technical data skills, structured through flexible engagement models that adapt to each client's scale. For companies that need ML-driven spend analytics without building a large onshore function, it offers a faster, lower-overhead path to getting there.
Frequently Asked Questions
What is the difference between traditional spend analytics and ML-powered spend analytics?
Traditional spend analytics relies on manual data preparation, periodic reporting, and rule-based categorization. It's slow, error-prone, and perpetually behind the data. ML-powered analytics automates those steps, delivers continuous real-time insights, and improves classification accuracy over time through model retraining.
How does machine learning improve spend data classification?
ML models are trained on labeled historical transactions, then use supplier names, descriptions, and transaction patterns to automatically assign new spend to the correct category. This achieves far greater speed and scale than manual approaches, and accuracy improves continuously as analysts validate edge cases.
What types of anomalies can ML detect in spend data?
Common flags include duplicate payments, invoice amounts that exceed norms for a given supplier, off-contract purchases, and transactions that don't match purchase order details. ML can flag these both at point of entry and through retrospective scans of historical data.
How does ML in spend analytics help with supplier risk management?
ML continuously monitors signals like delivery rates, payment patterns, and spend concentration, flagging emerging risks in real time. This enables earlier intervention rather than discovering a supplier problem after it has already disrupted operations.
What are the biggest challenges in implementing ML for spend analytics?
Data quality is the primary barrier - ML cannot fix fundamentally broken or incomplete source data. The second challenge is having skilled analysts who can validate outputs, maintain taxonomies, and translate insights into concrete sourcing actions.
How long does it take to see results from ML-driven spend analytics?
Initial classification and anomaly detection results are typically visible within weeks of implementation. Sustained value builds over the first few months as models refine, external data enriches the taxonomy, and teams act on insights.