Introduction
Most mid-market and PE-backed companies allocate between 50% and 80% of their cost base to external spend, according to McKinsey's procurement research. For most organizations, that spend flows out with little structured visibility into where it goes or what it actually costs them.
Procurement spend analysis turns that blind spot into structured intelligence. It pulls fragmented transaction data from ERPs, expense tools, and spreadsheets into a single view — showing which suppliers to consolidate, where spend is leaking off-contract, and which categories carry the most negotiating leverage.
The payoff is measurable. Research from Ardent Partners found that enterprises using automated spend analysis were 87% likely to identify sourcing opportunities — compared to just 47% for those relying on manual methods.
That 40-point gap separates proactive procurement functions from those perpetually playing catch-up.
This guide walks through what spend analysis is, how to run it step by step, and the best practices that separate high-performing programs from one-off projects in 2026.
Key Takeaways
- Procurement spend analysis collects, cleanses, classifies, and analyzes expenditure data to uncover savings, reduce risk, and sharpen supplier decisions.
- The process follows six stages: define objectives → collect data → cleanse and normalize → classify → analyze → act and review continuously.
- Common analysis types include category, supplier, tail spend, maverick, and payment term analysis — each revealing a distinct set of savings opportunities.
- Mid-market and PE-backed companies face unique constraints: siloed data, no dedicated analytics teams, and direct EBITDA pressure from unmanaged spend.
- 2026 best practices center on AI-assisted classification, dynamic taxonomies, external benchmarking, and structured initiative tracking.
What Is Procurement Spend Analysis?
Procurement spend analysis is the structured process of collecting, cleansing, categorizing, and analyzing an organization's expenditure data to answer six core questions:
- What are we buying?
- How much have we paid?
- How much have we bought?
- Who are we buying from?
- Who is buying internally?
- On what terms are purchases being made?
Key Terms Worth Distinguishing
These three terms are often used interchangeably — they shouldn't be:
- Spend data: raw transaction records from ERP systems, invoices, and purchase orders
- Spend data management: the process of organizing, storing, and maintaining that data
- Spend analysis: interpreting the data to generate actionable insights
Spend analytics refers to the broader application of advanced tools, AI, and predictive modeling on top of this foundation — the technology layer that speeds up and extends what analysts do manually.
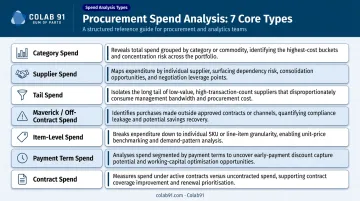
Types of Spend Analysis
Each type surfaces a different savings or risk angle:
| Analysis Type | What It Reveals |
|---|---|
| Category spend analysis | Price variance and consolidation potential by category |
| Supplier spend analysis | Concentration risk and renegotiation leverage |
| Tail spend analysis | Fragmented low-value spend from unmanaged vendors |
| Maverick/off-contract spend | Leakage from purchases outside approved channels |
| Item-level spend analysis | Unit price inconsistencies across business units |
| Payment term analysis | Working capital optimization opportunities |
| Contract spend analysis | Compliance gaps against negotiated agreements |
Why Procurement Spend Analysis Is Critical for Mid-Market and PE-Backed Companies
Efficio's indirect spend research found that only 19% of CPOs and CFOs have full visibility into indirect spend — and 85% say more than 25% of indirect spend has no financial oversight.
In a mid-market company generating $200M–$500M in revenue, that blind spot represents tens of millions in unmanaged spend.
For PE-backed companies, the stakes are higher. Procurement control is a direct EBITDA lever — and PE sponsors expect portfolio companies to demonstrate it. Kearney's research indicates cross-portfolio spend optimization can deliver 10% to 15% savings on addressable spend, which, depending on EBITDA margins, can be transformational for enterprise value.
The Compounding Mid-Market Problem
Large enterprises typically have dedicated spend analytics teams, mature P2P systems, and established category management functions. Mid-market companies rarely have any of these. As a result:
- Spend data lives across multiple ERPs, spreadsheets, and expense platforms
- No one has a complete picture of total organizational spend
- Supplier relationships are managed reactively, not strategically
- Maverick spend goes undetected — and APQC research shows organizations with 2%+ maverick buying incur $2.58 more in procurement costs per $1,000 in purchases than those below 1%
For a $300M revenue company spending even 20% of revenue on third-party goods and services, that $2.58 differential across hundreds of thousands of transactions is a seven-figure exposure — before accounting for missed negotiation leverage and supplier consolidation opportunities.
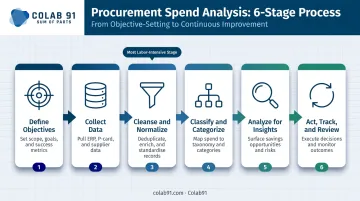
How Procurement Spend Analysis Works: A Step-by-Step Process
The six stages below follow a logical sequence. Poor data quality, unclear objectives, and lack of cross-functional buy-in are the most common failure points — and they derail programs before any value is generated.
AI and automation now handle much of the manual work in stages 2–4. Human judgment and domain expertise remain critical for interpreting results and turning them into action.
Step 1 — Define Your Objectives
Spend analysis without a clear objective produces data, not decisions.
Teams should anchor the exercise to a specific business goal before pulling a single record:
- Identify supplier consolidation opportunities
- Reduce maverick or off-contract spend
- Build an EBITDA improvement case for PE sponsors
- Improve contract compliance rates
- Develop a sourcing strategy for a specific category
Key metrics this stage impacts: analytical focus, stakeholder alignment, relevance of eventual insights to business priorities.
Step 2 — Collect and Consolidate Spend Data
Typical data sources include:
- ERP systems (SAP, Oracle, NetSuite, Dynamics)
- Accounts payable records
- Purchase orders and invoices
- Expense reports and T&E platforms
- Procurement platforms and catalogs
- Corporate credit card statements
Multi-entity environments require an extra normalization step before any analysis can begin. Without it, the same supplier appears under different names across business units, making spend totals unreliable.
Key metrics this stage impacts: data completeness, coverage breadth, spend visibility percentage.
Step 3 — Cleanse and Normalize the Data
Raw spend data is almost never analysis-ready. The most common issues:
- Duplicate supplier records under different name variations
- Inconsistent GL coding across business units
- Missing fields (no category code, no cost center, no contract reference)
- Currency and unit mismatches in multi-geography environments
Cleansing involves standardizing supplier names (including parent-child relationships), resolving duplicates, correcting miscodes, and applying consistent conventions throughout. McKinsey's 2024 CPO research found that 21% of CPOs have less than 70% of spend data in a single location — meaning for most organizations, this stage is more work than it appears.
Key metrics this stage impacts: data accuracy, consistency across business units, confidence in downstream analysis.
Step 4 — Classify and Categorize Spend
A well-structured spend taxonomy — category → subcategory → item level — is the backbone of meaningful analysis.
Organizations can use:
- UNSPSC — a global product and services classification system
- NAICS — useful for grouping suppliers by industry sector
- Custom taxonomies — built to reflect your specific supply market and internal structure
Apply the Pareto principle here: focus classification effort on the 20% of transactions that represent 80% of spend. Don't burn time on the long tail until the high-value categories are cleanly mapped.
Key metrics this stage impacts: category coverage, granularity of insight, speed of opportunity identification.
Step 5 — Analyze for Insights and Opportunities
This is where spend data becomes spend intelligence. The core analytical lenses to apply:
- Supplier concentration — how much spend sits with your top 10–20 vendors?
- Category benchmarking — are prices competitive against market rates?
- Contract compliance — what percentage of spend is occurring off-contract?
- Tail spend identification — how many low-value transactions with unmanaged vendors?
- Maverick spend detection — where are purchases bypassing approved channels?
- Payment term optimization — where can working capital be improved?
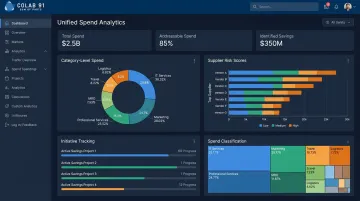
A spend cube (category × business unit × supplier) provides the most multidimensional view and is the standard for sophisticated analysis. Colab91's procurement analytics programs build this cube as the foundation, then layer in supplier risk scores, ESG ratings, contract terms, and addressable spend percentages. The result is a single analytical view that connects savings opportunities directly to supplier and category context.
Key metrics this stage impacts: savings identification rate, negotiation leverage, compliance gaps surfaced, decision confidence.
Step 6 — Act, Track, and Review Continuously
Spend analysis creates value only when insights convert to action. That means:
- Supplier renegotiations based on consolidated spend data
- Category consolidation initiatives with defined timelines
- Updated procurement policies and approved supplier lists
- Tighter PO controls and approval thresholds
- Quarterly review cycles to track realized vs. identified savings
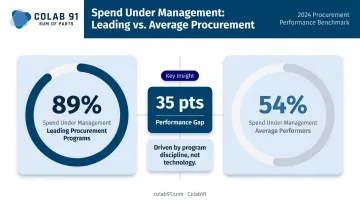
The most common failure is treating spend analysis as a one-time project. Best-in-class programs maintain a continuous review cadence. Ardent Partners data shows leading procurement departments place 89% of spend under management versus 54% for average performers. That 35-point gap is almost entirely a function of program discipline, not technology.
Key metrics this stage impacts: realized savings vs. identified savings, spend under management growth, process improvement velocity.
Procurement Spend Analysis in Action: A Real-World Walkthrough
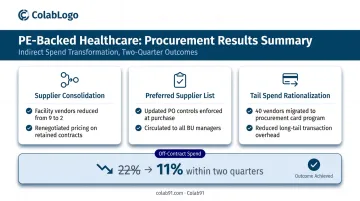
Consider a PE-backed healthcare services company at roughly $250M in revenue. The CFO suspects the company is overpaying across indirect categories but has no structured view — spend data lives across two ERPs and a corporate expense tool, and the procurement function is essentially one person managing vendor relationships reactively.
What the Analysis Found
After consolidating and cleansing the data (a step the team initially skipped, which led to inflated supplier count numbers — corrected in the second pass):
- $4M in addressable indirect spend consolidated across three categories: facility services, office supplies, and IT peripherals
- 22% of purchases occurring off-contract, primarily in facility services and professional services
- 800+ transactions under $500 from 60+ unmanaged vendors in the tail — collectively representing $1.2M in untracked spend
The initial uncleaned data showed 14 vendors supplying facility services. After normalizing supplier names and resolving parent-child relationships, the true count was 9 — but with pricing variance of up to 34% across locations for comparable services.
How Insights Became Action
The team launched three parallel initiatives:
- Supplier consolidation — facility services reduced from 9 vendors to 2 preferred suppliers, with renegotiated pricing based on consolidated volume
- Revised preferred supplier list — circulated to all business unit managers with updated PO controls requiring approval for out-of-list purchases
- Tail spend rationalization — 40 vendors below a minimum annual spend threshold moved to a procurement card program with category controls
The team established a quarterly review cadence to track contract compliance rates and realized savings against the identified pipeline. Within two quarters, off-contract spend had dropped from 22% to 11%.
Best Practices for Procurement Spend Analysis in 2026
Apply AI-Assisted Classification — With Human Verification
Modern AI tools can handle spend classification at scale, accurately processing thousands of line items that would take analysts weeks manually. But AI alone cannot understand business context. A purchase coded to "consulting services" might be legal fees, IT implementation support, or market research — and the category strategy for each is different.
Implement feedback loops that continuously refine the model, and flag edge cases in complex categories (MRO, IT services, direct materials) for human review. Colab91 pairs its AI-powered spend analytics platform with domain-experienced analysts who apply category judgment to what the algorithm surfaces — reducing misclassification rates in exactly the edge cases that matter most for sourcing strategy.
Build and Maintain a Dynamic Spend Taxonomy
A static category structure goes stale as sourcing strategies evolve, new suppliers enter the mix, and business units change how they buy. Leading programs review and update their taxonomy at least annually, applying changes consistently across all business units so comparisons remain valid.
Colab91 uses UNSPSC as its standard framework, with client-specific customizations built for each vertical — different category structures for healthcare, manufacturing, and retail reflect genuinely different supply markets, not just relabeled versions of the same template.
Enrich Internal Data With External Benchmarks
Internal spend data tells you what you paid. External benchmarks tell you what you should have paid. APQC benchmarks show a median 5.0% achieved savings rate delivered on sourcing events across a validated sample of 915 companies — a useful reference point for assessing whether your sourcing outcomes are competitive.
McKinsey's research cites Sanofi's use of should-cost modeling and analytics to achieve a 10% reduction in spend alongside a 281% increase in negotiation savings — a named enterprise case that illustrates what benchmark-driven negotiation can deliver when the analytical foundation is strong.
Close the Data-to-Action Gap With Structured Initiative Tracking
Many spend analysis programs produce excellent reports. Fewer translate those reports into tracked, owned savings initiatives. Best practice requires:
- Each identified opportunity assigned a clear owner
- A defined timeline and measurable savings target
- Realized savings tracked against the identified pipeline on a rolling basis
- Board-ready reporting that connects procurement performance to EBITDA impact
Colab91 structures this explicitly in its savings opportunity assessments — every output includes a category-by-category attack plan with owner, target, and timeline, not just a heat map of opportunity.
Foster Cross-Functional Ownership
Spend analysis cannot live in procurement alone. Finance validates categorization logic and confirms budget alignment. Operations confirms supplier performance data.
Business unit leaders add context that prevents false savings assumptions — for example, a vendor that looks consolidatable on paper but serves a specialized compliance function that makes consolidation impractical.
Mid-market companies without in-house analytics capacity can use dedicated offshore procurement analytics teams to handle the data-intensive work while keeping strategic decisions onshore. That's the model Colab91's "Sum of Parts" approach is built on: offshore execution efficiency paired with onshore strategic guidance and client-side domain context.
How Colab91 Can Help Build Your Procurement Analytics Capability
For mid-market and PE-backed companies that want to run rigorous, ongoing spend analysis programs without building an internal analytics function from scratch, Colab91 offers a purpose-built alternative.
Colab91 builds dedicated offshore procurement analytics teams in India — staffed with domain-experienced practitioners — that function as an extension of the client's procurement and finance organization. The team handles data aggregation and cleansing, category analysis, opportunity reporting, and savings tracking on an ongoing basis.
What distinguishes the Colab91 model:
- PE-native expertise: The leadership team spent two decades scaling offshore operations for PE sponsors including Carlyle Group, TPG, Elliott, and BC Partners — giving them direct familiarity with value-creation timelines, 100-day plans, and what operating partners actually need from a spend analysis program
- Spend intelligence platform: A unified data layer that cleanses, classifies (UNSPSC or client-specific), and enriches spend data with supplier risk scores, ESG ratings, contract terms, and addressable spend percentages — built for decision-making, not just reporting
- Quantified diagnostic: The Savings Opportunity Assessment delivers a prioritized savings roadmap within 4–6 weeks, typically surfacing 5–15% of addressable spend in actionable opportunities with specific owners, targets, and timelines
In practice, the model performs well in environments where spend data is fragmented and category visibility is hard to achieve internally. Pediatric Associates — a healthcare services organization with that exact profile — is one example of a client that has leveraged this approach to gain structured, category-level insight.
The engagement model is flexible: dedicated team, managed operations, or build-operate-transfer. Each option accounts for entity ownership, IP rights, ease of scaling, and the client's long-term strategic ambitions for offshore capability.
Conclusion
Procurement spend analysis is not a reporting exercise. It's a strategic capability that gives mid-market and PE-backed companies the visibility and leverage to reduce costs, manage supplier risk, and make faster, better-informed procurement decisions.
The six-stage process provides a repeatable framework. But the real value compounds when the program runs continuously — with clean data, a dynamic taxonomy, external benchmarks, and structured initiative tracking — rather than as an annual project that produces a slide deck and little else.
In 2026, the procurement functions that consistently create value are those that combine process discipline with the right analytical capability and domain expertise — and can sustain that combination without depending on a full in-house team to do it.
That's where firms like Colab91 come in. With offshore procurement analytics teams, AI-powered spend intelligence, and leadership that has built these programs for PE sponsors and mid-market companies across industries, Colab91 helps organizations move from one-time analysis to a continuous, compounding advantage.
Frequently Asked Questions
Frequently Asked Questions
What is the difference between spend analysis and spend analytics?
Spend analysis is the structured process of collecting, cleansing, classifying, and analyzing expenditure data to surface insights. Spend analytics is the technology layer on top — AI, advanced tools, and predictive modeling that make that analysis faster, more granular, and more scalable.
How often should a company conduct procurement spend analysis?
High-performing programs refresh spend data monthly or quarterly at minimum, rather than running it as an annual exercise. A continuous cadence lets teams track savings initiatives in near real-time and catch new opportunities as spend patterns shift.
What data sources are needed to run a procurement spend analysis?
Typical sources include ERP systems, accounts payable records, purchase orders, invoices, expense reports, procurement platforms, and corporate credit card statements. Multi-system environments require a consolidation and normalization step before any meaningful analysis can begin.
What are the most common reasons procurement spend analysis programs fail?
The top failure modes are poor data quality entering the process, no clear business objective anchoring the work, inadequate cross-functional buy-in, and treating the exercise as a one-time project rather than a continuous program with defined ownership and accountability.
What is spend under management (SUM) and why does it matter?
Spend under management is the percentage of total organizational spend actively managed through procurement processes. Higher SUM means better pricing control, contract compliance, and savings realization — it is a primary KPI for any spend analysis program. Ardent Partners reports that leading organizations achieve 89% SUM compared to 54% for average peers.
How does spend analysis support supplier consolidation?
Spend analysis reveals how many vendors are supplying similar goods or services, quantifies spend with each, and identifies categories where consolidating to fewer preferred suppliers would improve pricing leverage and reduce risk. The result is a data-backed consolidation case rather than an anecdotal one.