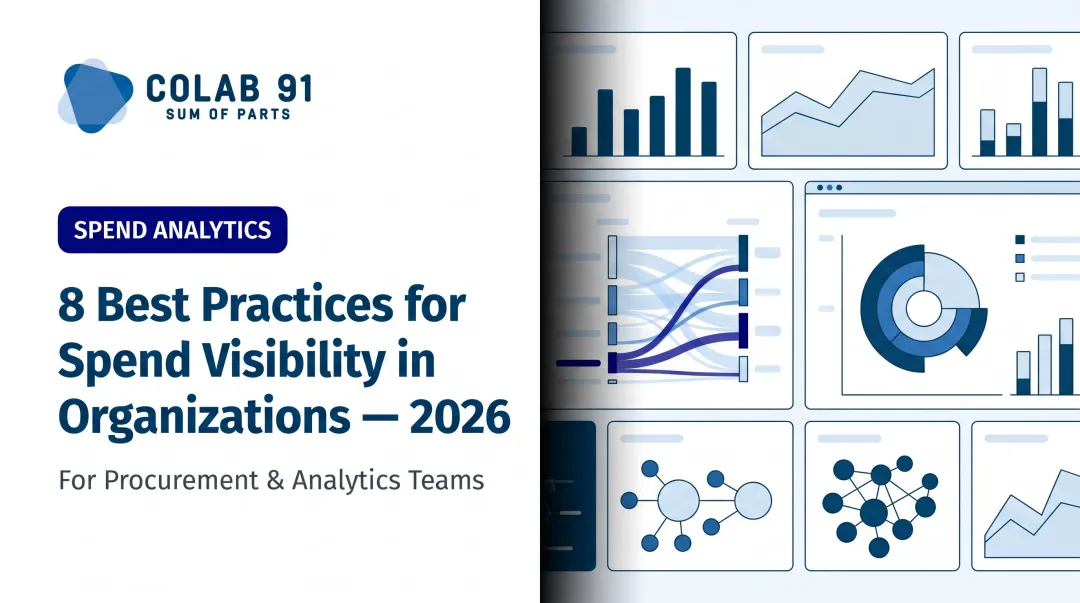
Introduction
CFOs in 2026 are navigating a difficult environment: cost volatility, PE-driven performance mandates, and board expectations for real-time financial clarity. Yet most mid-market organizations still lack a consistent framework for measuring what they can actually see and control in their spend.
The problem isn't a shortage of data. Procurement systems generate enormous volumes of transaction records. What's missing is the right metrics - standardized, financially grounded KPIs that turn raw purchasing data into insight executives can act on.
The 8 metrics below give CFOs a concrete framework for moving from lagging reports to forward-looking financial control - before problems reach the P&L.
Key Takeaways
- Spend visibility metrics only create value when they're actionable, consistent, and tied to financial outcomes - not procurement activity alone.
- This guide covers 8 metrics: from Addressable Spend Percentage and Contract Compliance Rate to Savings Realization Rate and Cycle Time Efficiency.
- Fragmented systems and inconsistent definitions corrupt even well-designed metric frameworks.
- Continuous tracking, not month-end reconciliation, is what separates reactive reporting from genuine financial control.
What Makes a Good Spend Visibility Metric?
Not every procurement KPI belongs on a CFO's dashboard. The ones that do share three characteristics:
- Actionable - the metric tells you what to do next, not just what happened
- Consistent - it holds the same definition across periods and business units, making comparisons meaningful
- Financially grounded - it connects procurement activity to a measurable bottom-line outcome
Lagging vs. Leading Indicators
Most procurement reports are lagging indicators - they tell you what was spent after the fact. CFOs need both types in their visibility framework:
| Indicator Type | Examples | Value |
|---|---|---|
| Lagging | Total spend by category, invoice totals | Confirms what happened |
| Leading | Price variance trends, maverick spend rate | Signals what is at risk |
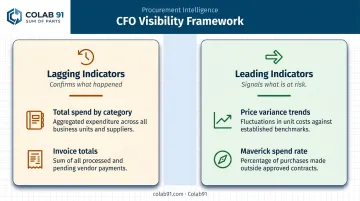
The leading indicators are where proactive financial management happens. By the time lagging data arrives, the budget impact is already locked in.
Both indicator types depend on the same underlying condition: clean, integrated data. Spend data quality, system integration, and standardized definitions determine whether your metrics reflect reality - or a version of it.
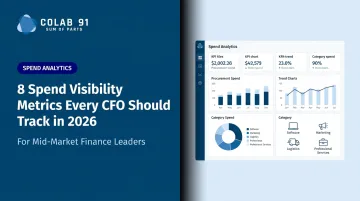
The 8 Spend Visibility Metrics CFOs Should Track in 2026
Together, these eight metrics form a complete picture of spend health: where money goes, where leverage exists, where value leaks, and where to act first.
Metric 1: Addressable Spend Percentage
What it measures: The portion of total spend that can realistically be influenced through negotiation, sourcing, or category management - excluding spend that's fixed, regulated, or contractually locked.
Why it matters: Without this number, procurement teams chase savings that don't exist. A category with 5% addressable spend will never move the needle, regardless of how sophisticated the sourcing strategy is.
How CFOs use it: High addressable spend in an unmanaged category signals an immediate opportunity. Low addressable spend means energy is better spent elsewhere. Procurement investment should follow addressability, not category size alone.
A low addressable spend percentage often indicates one of three things:
- Excessive long-term contracts with unfavorable terms baked in
- Spend trapped in single-source supplier relationships
- Inadequate category strategy that hasn't kept pace with business growth
When examining this metric, start with categories that carry significant spend volume but have never been formally sourced. That's typically where the highest-impact, fastest-capture opportunities sit.
Metric 2: Category Coverage Ratio
What it is: The percentage of total spend actively managed under a formal procurement strategy, versus spend that is unmonitored or uncategorized.
Why it matters: Unmanaged categories are effectively invisible to cost-reduction efforts. KPMG's procurement research found that only 41% of procurement executives rate category management as highly mature - which means the majority of organizations have meaningful gaps in their coverage.
How CFOs use it: Map category coverage against spend volume. High-spend, low-coverage categories represent the highest-priority intervention points. Build a roadmap that sequences coverage expansion by financial impact, not by operational convenience.
The taxonomy trap: The most common reason category coverage appears artificially high is inconsistent spend classification across ERP systems and procurement tools. When the same supplier gets coded differently across systems, spend looks more dispersed - and coverage looks better - than it actually is. Standardizing category definitions before reporting this metric is what makes the number credible.
Metric 3: Supplier Concentration Index
What it is: The percentage of total spend flowing to the company's largest suppliers - typically measured as the share held by the top 5, 10, or 20 suppliers.
Why it matters: High concentration with strategic suppliers can deliver better pricing, stronger service commitments, and relationship leverage. The same concentration, however, creates supply chain vulnerability when a top-five supplier experiences disruption, financial stress, or capacity constraints.
The risk is growing. Deloitte's 2023 CPO Survey found that only 25% of organizations could identify and predict supply disruptions in a timely manner - and 43% of CPOs reported overall procurement risk increased significantly.
How to use it: Track concentration by spend tier and flag when any single supplier approaches threshold levels that would create operational dependency. For PE-backed companies specifically, supplier concentration is a due diligence factor - boards and acquirers scrutinize single-source relationships as operational risk during exit processes. Monitor this metric with that lens in mind.
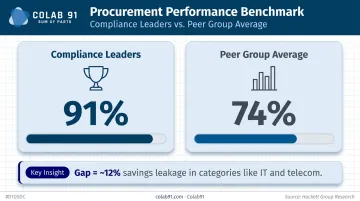
Metric 4: Contract Compliance Rate
What it is: The percentage of purchases made through negotiated contracts versus total purchases, measured by category or across the organization.
Why it matters: A well-negotiated contract delivers exactly zero value if buyers routinely ignore it. Hackett Group research benchmarks show compliance leaders averaging 91% compliance rates, while peer-group companies average just 74%. That gap represents direct savings leakage - Hackett data shows peer-group companies lose approximately 12% of targeted savings in categories like IT and telecom due to non-compliance alone.
What's really behind low compliance rates: It's tempting to treat this as a user behavior problem. It usually isn't. Low compliance rates typically reflect:
- Poor contract visibility (buyers don't know the contract exists)
- Unclear purchasing policies with no enforcement mechanism
- Inadequate approval workflows that make off-contract paths easier
- Catalog gaps that force buyers to find alternatives
CFOs should treat a low contract compliance rate as a systems and process problem, then design the fix accordingly.
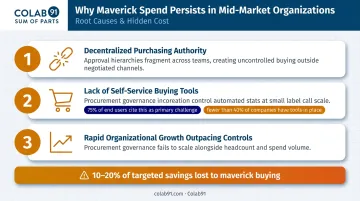
Metric 5: Maverick Spend Percentage
What it is: All purchases made completely outside of approved procurement channels - bypassing contracts, preferred vendors, and formal approval workflows entirely. This is distinct from off-contract spend, which may still pass through procurement. Maverick spend skips the process altogether.
Why it matters: It's the highest-risk category for both cost control and compliance exposure. Hackett data indicates companies can lose 10–20% of targeted savings directly attributable to maverick buying. When a P2P platform is implemented to close off maverick channels, the data shows roughly a 60% reduction in savings leakage from that source.
What drives it in mid-market companies:
- Decentralized purchasing authority with no formal PO process
- Lack of self-service or guided buying tools - Hackett found 75% of end users cited this as their primary purchasing challenge, yet fewer than 40% of companies had such tools in place
- Rapid organizational growth that scales informal buying habits faster than procurement policy can keep up
The mid-market growth context matters. Companies that double headcount in two years often find their procurement controls haven't kept pace. Maverick spend percentage makes that gap visible - and measurable.
Metric 6: Price Variance Tracking
What it is: The difference between actual prices paid and baseline or market benchmark prices for equivalent goods and services.
Why it matters: This is the CFO's early warning system for inflation exposure, supplier price creep, and missed renegotiation windows. With 89% of organizations reporting high or moderate cost and spend inflation impact according to Deloitte, the ability to distinguish between unavoidable market-driven cost increases and negotiable supplier-driven price increases is a direct budget management capability.
The timing advantage: Quarterly price reviews are structurally too slow. By the time a quarterly report flags a 15% price increase from a key supplier, several months of budget impact have already materialized. Real-time or near-real-time price variance tracking changes the response window entirely - teams can lock in forward pricing, trigger renegotiation clauses, or adjust category sourcing strategy before the increase hits the P&L.
Price variance tracking is most valuable when it triggers action before costs land - not after they appear in a budget review.
Metric 7: Cycle Time Efficiency
What it is: The elapsed time from purchase requisition approval to purchase order issuance - measured in calendar days per APQC's standard methodology.
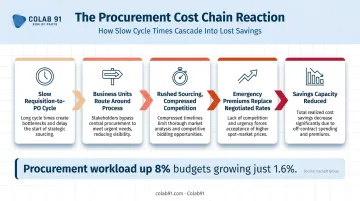
Why it matters: Slow cycle times create a chain reaction that CFOs rarely see in the data. When procurement takes too long, business units route around the process. Sourcing becomes rushed, supplier competition gets compressed, and emergency premiums replace negotiated rates. The cost impact is indirect but cumulative.
There's also a capacity dimension. Hackett research shows procurement workload is expected to rise 8% while budgets grow just 1.6%. Long cycle times reduce how many competitive sourcing events can happen in a fiscal year - which directly caps savings capture potential.
Cycle time benchmarks vary significantly by category complexity. Direct spend categories with detailed specifications require more time than standard indirect purchases. The relevant comparison isn't cycle time in isolation - it's whether your cycle times allow enough sourcing events to actually deliver on savings targets.
Metric 8: Savings Realization Rate
What it is: The percentage of negotiated or identified savings that actually flows through to the financial statements - as opposed to savings that remain on paper, get consumed by volume changes, or never reduce actual invoice amounts.
Why it matters: This is the single most important accountability metric for the CFO-procurement relationship. Procurement can report impressive savings figures while the P&L shows no corresponding improvement. That gap erodes trust - and more concretely, means the organization isn't capturing the value it believes it has.
The most common reasons savings don't realize:
- Off-contract purchasing bypasses negotiated agreements entirely
- Demand increases offset unit cost reductions (lower price, higher volume = same total spend)
- One-time savings counted as recurring in future-period projections
- Savings measured against inflated or outdated baselines
For PE-backed companies, this metric carries additional weight. Boards and sponsors increasingly require auditable savings documentation - not procurement-reported figures, but verified P&L impact. Teams with experience supporting PE clients, including those working on exits for firms like Carlyle Group and TPG, know that savings claims without financial statement traceability carry no weight in due diligence conversations.
Common Visibility Gaps That Undermine These Metrics
Knowing which metrics to track is only half the problem. Execution breaks down at the data layer.
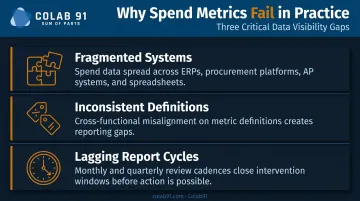
Three gaps account for most failures:
- Fragmented systems: Spend data lives across ERPs, procurement platforms, supplier portals, AP systems, and departmental spreadsheets - each with its own structure and update cadence. A unified view requires intentional integration work; it doesn't happen by default.
- Inconsistent definitions: When "maverick spend" means different things to procurement versus finance, both teams produce different numbers and neither trusts the other's reporting. Cross-functional alignment on metric definitions is a data quality requirement, not a political nicety.
- Lagging report cycles: Monthly or quarterly reviews mean the spend has already happened, the budget has already moved, and the intervention window has closed before anyone sees the data. Real-time or near-real-time infrastructure is a prerequisite for using these metrics as management tools - not a future-state ambition.
Turning Metrics Into Action
Metrics only create value when they are reviewed consistently, assigned to accountable owners, and connected to decision-making workflows. A practical review cadence for a mid-market CFO might look like:
- Weekly: Price variance, maverick spend percentage (high-risk, fast-moving)
- Monthly: Category coverage, contract compliance rate
- Quarterly: Savings realization rate, supplier concentration index
Sustaining these metrics requires two things: the technology layer (integrated data, spend analytics tooling) and the human layer (analysts who can interpret the data, identify root causes, and translate findings into sourcing decisions).
This is where many mid-market companies hit a wall. The analytical capacity needed to run a mature spend visibility program - spend data analysts, category intelligence, savings tracking - is expensive to build onshore and difficult to maintain at consistent quality. PE-backed companies with lean central teams feel this most acutely.
Colab91 addresses this gap by building dedicated offshore procurement analytics teams for mid-market and PE-backed clients - domain experts who provide continuous coverage rather than project-based engagements. Working with clients including Carlyle Group, TPG, and Pediatric Associates, the firm treats analytical capacity as a permanent organizational capability, not a resource assembled at year-end.
According to Hackett Group benchmarking, Digital World Class procurement organizations generate 2.5x higher ROI and deliver nearly 2x spend cost reduction savings compared to peers. That gap is largely an analytics and execution capacity gap - not a strategy gap.
For CFOs serious about closing that gap in 2026, the lever isn't a better dashboard - it's the analytical capacity to act on what the data shows, week after week.
Conclusion
These 8 metrics together cover the full spectrum of spend health: what you can control (addressable spend, category coverage), where value leaks (maverick spend, savings realization), and where risk is building (supplier concentration, price variance). No single metric tells the whole story. The power is in tracking all eight consistently, with clean data and accountable owners.
The honest question for any CFO reading this: how many of these metrics does your organization actually track with confidence? Ask yourself:
- Which metrics are being estimated rather than measured?
- Which are approximated because the underlying data isn't clean?
- Which are skipped entirely - and quietly accepted as blind spots?
The gap between what you think you know about your spend and what the data would actually show is where budget overruns live.
If you're a mid-market or PE-backed company looking to close that gap, Colab91 works with organizations in exactly this position. The engagement typically starts with a savings opportunity assessment - a structured review that surfaces where your visibility ends and what it's costing you.
Whether you need better data infrastructure, offshore analytics capacity, or a clearer picture of where savings are being left on the table, that assessment gives you a concrete starting point. Reach out to start the conversation.
Frequently Asked Questions
What is spend visibility and why does it matter to CFOs?
Spend visibility is the ability to track all organizational purchasing across departments, categories, and suppliers in real time. Without it, CFOs make budget and resource decisions with incomplete information, leading to cost overruns, missed savings opportunities, and reactive financial management that's always one step behind actual spending.
What is the difference between addressable spend and total spend under management?
Addressable spend is the portion of total spend that procurement can realistically influence through negotiation or category management. Spend under management is all spend actively covered by a procurement strategy. Addressable spend is always a subset, and it defines where cost reduction efforts will actually produce results.
How is savings realization rate calculated and why does it differ from negotiated savings?
Savings realization rate is the percentage of identified or negotiated savings that is confirmed in the financial statements. The gap between negotiated and realized savings occurs when off-contract purchases, volume increases, or inconsistent measurement approaches prevent savings from actually flowing to the P&L.
What is considered a high maverick spend percentage and what causes it?
There's no universal threshold, but consistently high rates signal weak policy enforcement, absent PO processes, or growth that outpaced procurement infrastructure - mid-market companies scaling quickly are especially vulnerable as informal buying habits embed before controls are in place.
How often should CFOs review spend visibility metrics?
A tiered cadence works best: weekly for price variance and maverick spend, monthly for category coverage and contract compliance, and quarterly for savings realization and supplier concentration. Real-time dashboards are replacing scheduled reports for organizations that need faster response windows.
What is the biggest barrier to tracking spend visibility metrics accurately?
Fragmented data systems and inconsistent metric definitions across departments. Producing CFO-grade spend reporting on a continuous basis requires both integrated technology and the analytical talent to interpret it reliably.