Introduction
Most procurement teams at mid-market and PE-backed companies aren't flying blind by choice. They're dealing with spend data scattered across multiple ERPs, department-managed spreadsheets, and purchasing tools that never talk to each other. The result is no clear picture of where money is going - and no early warning when costs start drifting.
This fragmentation is widespread. Deloitte's 2025 Global CPO Survey found that 57% of CPOs cited siloed ways of working as a top barrier to delivering value - ahead of budget constraints and competing priorities.
The fix starts with the right KPIs, tracked consistently against clean data. Properly defined, spend analysis KPIs are more than reporting outputs - they surface supplier negotiation opportunities, expose cost leakage, and tie directly to EBITDA improvement.
This guide covers the 10 most critical spend analysis KPIs, how they're defined, and how to prioritize them based on where your organization actually is.
Key Takeaways
- Spend analysis KPIs track where money goes, how efficiently it flows, and where value is leaking.
- The 10 KPIs fall across four areas: cost performance, supplier health, contract compliance, and spend visibility.
- Start with foundational KPIs: cost savings, supplier utilization, maverick spend, and contract compliance.
- Without consolidated, cleansed spend data, well-defined KPIs still produce unreliable numbers.
- Consistent KPI tracking - not one-time reporting - is what separates reactive procurement from strategic procurement.
Why KPIs Are the Backbone of Spend Analysis
A metric measures activity. A KPI measures progress toward a strategic outcome. The number of purchase orders issued this quarter is a metric. The percentage of total spend actively managed by procurement is a KPI.
That distinction matters because procurement teams can generate dozens of metrics from ERP data without moving any needle that finance or leadership actually cares about.
A meaningful spend analysis KPI must be:
- Tied to a specific business outcome (cost reduction, supplier risk, contract value capture)
- Measurable against a defined baseline or target
- Actionable - meaning someone can and should do something when the number moves
- Consistently tracked over time, not pulled on demand
All four criteria above depend on one thing most KPI guides skip: data quality. Specifically, the underlying data must be consolidated and classified before any KPI can be trusted. Pulling a "cost savings" number from three different ERP instances with inconsistent category coding doesn't produce a KPI - it produces a number that procurement and finance will argue about for a quarter.
McKinsey has noted that only 20–40% of the data needed for effective sourcing is typically stored centrally. That data fragmentation is exactly why so many spend KPIs get disputed rather than acted on. Fix the data layer first - everything else follows from there.
KPIs 1–4: Measuring Cost Performance
These four KPIs form the financial foundation of any spend analysis program. They're typically the first metrics PE sponsors and finance leaders ask about when assessing procurement maturity.
KPI 1: Cost Savings (Year-over-Year)
Cost savings measures the actual reduction in price achieved for equivalent goods or services - expressed as a percentage of total spend or in absolute dollar terms and tracked year-over-year.
The common mistake is treating this as a single aggregate figure. A company-wide savings number tells you almost nothing. Segment it by category, supplier, and business unit to make it actionable. A 3% savings rate in one category might mask a 7% cost increase in another.
Also account for seasonality and category mix shifts, or you risk comparing unlike baskets and drawing the wrong conclusions.
KPI 2: Cost Reduction vs. Cost Avoidance
These two are frequently collapsed into one number - a distinction that matters when making the procurement case to finance leadership.
| Type | Definition | P&L Impact |
|---|---|---|
| Cost Reduction | Eliminates an existing expense (e.g., renegotiated rate) | Reflected in financial statements |
| Cost Avoidance | Prevents a future cost (e.g., early renewal before a price increase) | Not reflected in statements |
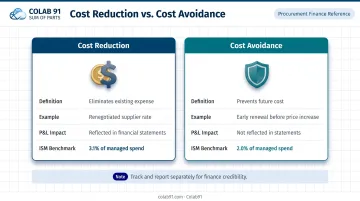
According to ISM, citing CAPS Research data, the overall average for cost avoidance is 2.0% of managed spend, versus 3.1% for cost savings, a gap that signals how much future spend protection goes unrecognized.
Finance teams typically won't accept cost avoidance claims without documentation. To make it credible: tie each avoidance event to a specific decision, a counterfactual price (market index or supplier quote), and a dated record of the event. Vague estimates don't survive budget reviews.
KPI 3: Spend Under Management (SUM)
SUM is the percentage of total organizational spend actively overseen by procurement: direct materials, indirect categories, MRO, and all business units.
Why it matters: A company with $100M in annual spend and 55% SUM has $45M essentially invisible to procurement. No contracts, no volume leverage, no compliance enforcement. CAPS Research identifies managed spend as a primary indicator of a company's ability to capture value from supply management.
SUM is also directly connected to KPI 8 (maverick spend). Every dollar that flows outside procurement channels reduces SUM. For mid-market companies, closing that gap tends to deliver the highest ROI of any procurement initiative: the unmanaged spend pool is typically large and completely untouched.
KPI 4: Procurement Cost Reduction Potential
This KPI tracks the gap between current spend and what's achievable through structured sourcing, your remaining savings runway. It's most useful during the diagnostic phase of a new engagement or after an acquisition.
McKinsey's research on PE-backed companies shows that digital procurement tools and advanced analytics can reduce historical procurement costs by 15–30%, with a well-executed transformation lifting EBITDA by 20% within six months. For PE sponsors, that's not a cost center story - it's a value creation one.
KPIs 5–7: Supplier Health and Contract Integrity
Supplier KPIs reveal whether the relationships underpinning your supply chain are actually performing as negotiated - and whether the value you contracted for is being captured.
KPI 5: Supplier Performance Score
A composite score pulling together:
- On-time and in-full (OTIF) delivery rate
- Quality and defect rates
- Service-level adherence
- Pricing consistency vs. contract terms
Tracking these dimensions separately creates silos. A supplier with 98% OTIF but consistent quality escapes and off-contract pricing isn't a healthy supplier. A unified score surfaces that.
One dimension often overlooked: supplier dependency. What percentage of critical spend is concentrated with a single vendor? Deloitte's 2025 CPO survey found 74% of CPOs actively maintain alternative sources as a risk-mitigation strategy. High concentration without alternatives creates both negotiation leverage risk and supply continuity exposure.
KPI 6: Purchase Price Variance (PPV)
PPV is the difference between the expected (standard) purchase price and the actual price paid. Positive PPV means you paid more than planned - and when it's consistent, that's a signal to renegotiate.
Common drivers of unfavorable variance:
- Outdated pricing sheets not reflecting contract updates
- Rush orders bypassing preferred suppliers
- Volume shortfalls that void tier pricing
- Supplier swaps made without procurement involvement
Finance teams understand PPV intuitively, which makes it one of the easier KPIs to gain cross-functional traction on. Track it at the category, supplier, and SKU level - aggregate PPV numbers hide the specific sources of leakage.
KPI 7: Contract Compliance Rate
Contract compliance rate measures the percentage of purchases made under active contract terms - both buyer-side (purchasing on-contract vs. off-contract) and supplier-side (delivering at agreed pricing and service levels).
Low compliance on either side destroys the realized value of negotiated agreements. According to The Hackett Group, Digital World Class procurement teams experience 60% less savings leakage from maverick buying and contract non-compliance. That gap shows how much value typical organizations leave on the table.
Off-contract purchases also bypass the volume thresholds that trigger better pricing tiers. Less spend on contract means less leverage in the next negotiation - the leakage compounds over time.
KPIs 8–10: Spend Visibility and Control
These KPIs focus on the structure and distribution of spend - ensuring money flows through the right channels at the right level of organizational visibility.
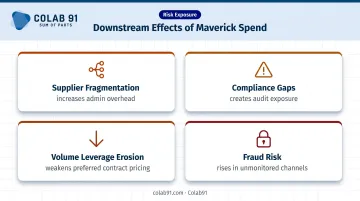
KPI 8: Maverick Spend Rate
Maverick spend (also called rogue or off-policy spend) covers purchases made outside approved procurement channels, preferred supplier agreements, or authorized workflows. It typically starts small - a department bypassing approvals for speed, a one-off direct order - but accumulates into a meaningful share of total spend that procurement can't see or control.
The downstream effects extend beyond missed pricing:
- Supplier fragmentation increases admin overhead
- Compliance gaps create audit exposure
- Volume leverage erodes across preferred contracts
- Fraud risk rises in unmonitored purchasing channels
Reducing maverick spend requires process enforcement and stakeholder education. Policy documents that nobody reads don't move the needle. The target should be a specific, stated reduction goal - not just a vague aspiration to "reduce off-contract purchasing."
KPI 9: Spend by Category and Contribution to Total Spend
This KPI breaks down organizational spend across categories, suppliers, and business units to show which areas account for the largest share of total spend.
The strategic value: it tells you where to focus first. The Pareto principle holds consistently in procurement - according to McKinsey's tail spend research, tail spend typically represents 80–90% of a company's total SKUs but only 10–20% of total spend, with 5–15% savings potential when that tail goes unmanaged.
This KPI also surfaces shadow spend - categories like SaaS subscriptions and consulting engagements that may not yet be formally managed by procurement but represent growing cost exposure. If it doesn't appear in the category breakdown, it's growing outside your control.
KPI 10: Supplier Count and Consolidation Rate
This KPI tracks the number of active suppliers per category and how concentrated spend is among preferred vendors. A fragmented supplier base inflates admin overhead, sacrifices volume leverage, and creates quality inconsistency.
McKinsey documented a tail-spend case where one company consolidated from several hundred suppliers down to approximately 50, achieving 5–10% total tail-spend savings in the process. The goal is to identify where consolidation creates real leverage - deeper preferred relationships, stronger pricing, and fewer vendors to manage.
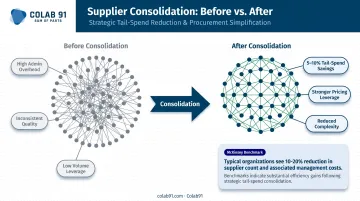
Companies that have grown through acquisitions or lack centralized procurement typically carry the most fragmentation here - and, as a result, the most untapped consolidation potential.
How to Prioritize These KPIs Based on Your Organization's Maturity
Not all 10 KPIs should be tracked from day one. Chasing advanced metrics without the data infrastructure to support them produces noise rather than insight.
Start with the foundational four:
- Cost savings (year-over-year)
- Spend under management
- Maverick spend rate
- Contract compliance rate
These four require the least analytical sophistication and deliver the clearest picture of whether procurement is functioning. They're also the KPIs most likely to surface the highest-value opportunities quickly.
Once you have consistent data and a reporting cadence, layer in:
- Supplier performance scoring
- PPV analysis
- Category contribution views
For PE-backed companies, this maturity progression carries additional weight. PE sponsors evaluate portfolio companies on procurement maturity as a value creation lever, and KPIs like spend under management and cost savings have direct line-of-sight to EBITDA improvement. A consistent KPI tracking function - reviewed regularly, not pulled once before a board meeting - demonstrates that procurement operates as a strategic function with measurable accountability.
The more common barrier to consistent KPI tracking is analytical capacity, not missing data. Mid-market companies rarely have the internal headcount to run continuous spend analysis alongside day-to-day finance and procurement responsibilities.
Colab91 addresses this directly. By building offshore capability centers staffed with domain experts in strategic sourcing and spend analytics, Colab91 gives mid-market and PE-backed companies the continuous monitoring infrastructure these KPIs require, without the cost of a fully scaled onshore team.
Conclusion
Spend analysis delivers value through action - renegotiating contracts, consolidating suppliers, pushing spend under management higher, and tightening compliance quarter over quarter. The KPIs don't create that value. What you do with them does.
The 10 KPIs in this guide provide a framework to do exactly that. Start with the foundational four. Get the data layer right. Then build toward the full picture.
Building that full picture requires consistent analytical capacity - not a one-time report. For mid-market and PE-backed organizations looking to run spend analysis as an ongoing function rather than a quarterly scramble, Colab91's offshore procurement teams provide the domain expertise and operational depth to make that work. Connect with the Colab91 team to see how a dedicated capability center fits your procurement model.
Frequently Asked Questions
Frequently Asked Questions
How do you perform a spend analysis?
Collect and centralize spend data from all sources - ERP, invoices, P-cards, and department tools - then cleanse and classify it by category and supplier. From there, analyze patterns to identify savings opportunities, compliance gaps, and supplier consolidation options.
What are the main KPIs for spend analysis?
Core KPIs include spend under management, cost savings, cost avoidance, maverick spend rate, contract compliance, purchase price variance, supplier performance, and spend by category. Which metrics matter most depends on organizational maturity and strategic priorities.
What is an example of a spend analysis?
A PE-backed healthcare company aggregates spend across 12 facilities, discovers 40% of indirect spend is off-contract with fragmented suppliers, and uses that insight to consolidate vendors and renegotiate contracts, cutting indirect spend costs materially within a single cycle.
What is the difference between cost savings and cost avoidance?
Cost savings reduce an existing, active expenditure: for example, a renegotiated supplier rate. Cost avoidance prevents a future cost from occurring, such as locking in current pricing before a market increase. Both are legitimate procurement KPIs, tracked and reported separately.
What is spend under management (SUM) and why does it matter?
SUM is the percentage of total company spend actively overseen by procurement. A higher SUM gives organizations more leverage to enforce contracts, negotiate better pricing, and reduce maverick purchasing. It's a foundational indicator of procurement maturity.
How often should you review spend analysis KPIs?
Core financial KPIs (savings, SUM, and maverick spend) should be reviewed monthly. Supplier performance and compliance KPIs suit quarterly reviews, with an annual deep-dive to reset targets against business goals and market benchmarks.