Introduction
Gartner forecasts worldwide IT spending will reach $6.15 trillion in 2026, up 10.8% from the prior year. Inside that growing number sits a quieter problem: according to Zylo's 2026 SaaS Management Index, 36% of SaaS licenses go completely unused, with the average organization wasting $19.8M annually on software that nobody is actively using.
That gap is what IT leaders navigate every day. Boards want innovation. CFOs want tighter budgets. And somewhere in the middle, spend is quietly bleeding out through auto-renewed subscriptions, tools bought by marketing without IT's knowledge, and cloud resources provisioned three quarters ago that no one right-sized.
IT spend isn't inherently expensive. It becomes expensive through poor visibility, reactive procurement, and ungoverned growth that compounds month over month. What follows covers where that cost originates, which levers actually move the needle, and the operating model changes that keep savings from slipping back.
Key Takeaways
- 36% of SaaS licenses go unused — waste accumulates gradually, not through single large purchases
- Decentralized purchasing is the primary structural driver: IT directly controls only 15% of SaaS spend
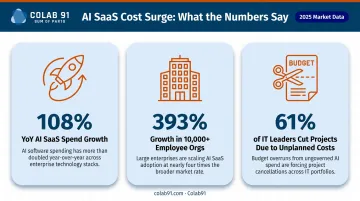
- AI-native SaaS spend grew 108% year-over-year, making it the fastest-rising ungoverned cost category
- Effective optimization spans procurement decisions, governance, and operating model — not just cost-cutting
- Spend optimization is a continuous discipline — not a one-time budget exercise
How IT Costs Build Up Over Time
IT overspend rarely shows up as a single line item that anyone can point to. It accumulates — through subscription renewals nobody reviewed, seat expansions approved informally, and one-off tool purchases made by individual teams that never entered a central register.
The pattern follows two distinct tracks:
Slow compounding waste:
- SaaS licenses that auto-renew without a utilization review
- Cloud resources provisioned for a project that ended six months ago
- Duplicate tools purchased by different business units solving the same problem
Episodic exposure:
- M&A activity that doubles the application portfolio overnight
- Rapid headcount growth that triggers seat expansions without corresponding rationalization
- A vendor audit or security review that surfaces previously invisible spend
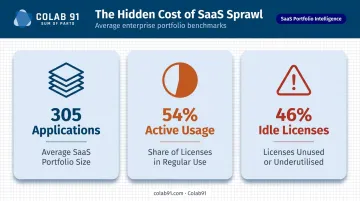
The average organization runs a portfolio of 305 applications, and Zylo's data shows only 54% of those licenses are actively used. That means nearly half of what organizations pay for sits idle — but it keeps renewing because no review process exists to catch it before the next cycle fires. By the time a CFO mandate or budget review surfaces the gap, the compounding has already done its damage.
Key Drivers of Rising IT Spend
Understanding where cost comes from is a prerequisite for addressing it. Three structural forces drive the majority of IT overspend.
Decentralized Purchasing
According to Zylo's 2026 SaaS Management Index, business units now control 81% of SaaS spend while IT directly manages only 15%. Expense-based SaaS purchasing — employees buying tools on corporate cards — increased 267% year-over-year, with ChatGPT as the most expensed application.
When procurement is fragmented across departments, IT loses the visibility needed to prevent duplication, enforce security standards, or negotiate from a position of consolidated spend.
Vendor Contract Structures
Most enterprise software contracts are structured in ways that work against buyers who aren't actively managing them:
- Auto-renewal clauses extend subscriptions automatically unless the buyer opts out within a defined notice window
- Rigid seat-count models keep organizations paying for peak headcount capacity even after workforce reductions
- Minimum spend commitments lock in volume that made sense at signing but no longer reflects current usage
Left unmanaged, these structures consistently produce spend that outpaces actual need.
The AI Cost Variable
AI-native SaaS spend grew 108% year-over-year overall, and 393% in organizations with more than 10,000 employees. The cost surprises aren't minor: 78% of IT leaders in Zylo's survey reported unexpected charges tied to AI features or consumption-based pricing. More telling, 61% cut projects outright due to unplanned SaaS cost increases.
AI tooling is becoming the next generation of shadow IT. The consumption-based pricing models common in AI products create cost exposure that fixed-seat SaaS contracts do not, making usage tracking and ROI measurement essential — not optional.
Strategies to Optimize IT Spend
Effective optimization does not follow a single playbook. The right levers depend on whether cost originates in how tools were selected, how they are currently governed, or how the operating model around IT is structured. The three dimensions below address each.
Strategies That Change Procurement Decisions
A significant share of IT overspend is locked in at the point of purchase — when teams buy tools without cross-referencing existing capabilities or negotiating terms that reflect actual usage. These strategies intervene before cost is committed.
Conduct a full IT and SaaS audit before any new procurement
Catalog every active application, license count, and renewal date. This exercise consistently surfaces redundant tools and zero-usage subscriptions. Momentive used this approach to cancel 222 applications, saving $7M over three years (per Zylo case data). The audit creates the foundation for a rationalized portfolio and prevents duplicate purchasing.
Adopt zero-based renewal evaluation
Rather than automatically renewing contracts, require each tool to justify continued investment based on:
- Active usage data against the licensed seat count
- Demonstrated linkage to a business outcome
- Comparison against available alternatives
This shifts the organizational default from "keep everything" to "earn its place."
Consolidate vendors to create pricing leverage
Reducing the number of active vendors in a category allows negotiation of volume discounts and favorable multi-year terms. BetterCloud reports that 53% of IT departments consolidated redundant SaaS applications in 2024 — a clear signal that consolidation has moved from a theoretical recommendation to standard practice. This requires cross-functional alignment between IT, procurement, and finance to be effective.
Establish a pre-approved vendor catalog
Guided buying guardrails reduce shadow IT by making the approved procurement path the path of least resistance. When the approved catalog is easy to navigate, teams stop buying on corporate cards to avoid the process.
Strategies That Change How IT Is Managed
Even well-selected tools generate waste when governance is absent. These levers address ongoing management discipline.
Build real-time spend visibility
A centralized dashboard aggregating SaaS, cloud, and IT services spend across all departments is the minimum viable infrastructure for optimization. Without it, decisions are made on assumptions rather than data.
The dashboard should surface:
- Spend by vendor and total contract value
- License utilization rate per tool
- Upcoming renewal dates (90/60/30-day views)
- Cost per active seat
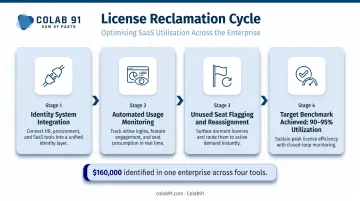
Automate license reclamation
Connecting license management to identity and access systems allows unused seats to be flagged and reassigned automatically when employees offboard or stop using a tool. Zylo's case data shows one enterprise identified approximately $160,000 in next-quarter savings across just four tools using this approach. At scale, reclamation becomes a continuous savings engine rather than a manual, infrequent project.
Zylo recommends targeting 90–95% license utilization as the operational benchmark.
Introduce cost allocation through showback or chargeback
When business units can see the IT spend attributed to their usage, they become active participants in optimization rather than passive consumers. The FinOps Foundation draws a clear distinction: showback surfaces cost attribution for awareness, while chargeback formally transfers costs to business unit budgets. Both create the accountability that top-down mandates rarely achieve.
Benchmark spend regularly
Comparing IT spend as a percentage of revenue, per-seat costs, and renewal pricing against peer organizations provides both a diagnostic signal and negotiating leverage. Without benchmarks, there is no reliable way to know whether current pricing represents market rate or significant overpayment.
Strategies That Change the Operating Context
In many organizations, the underlying cost driver is not the IT portfolio — it is the operating model surrounding it. Fragmented ownership, IT-finance silos, and insufficient analytical capacity mean optimization efforts rarely sustain.
Align IT and finance around shared metrics
IT-finance collaboration moves spend decisions from reactive to strategic. When these two functions operate in separate systems with separate data, budget constraints and usage realities are never reconciled in real time. A shared view of spend — mapped to business outcomes — is what makes that reconciliation possible.
The Technology Business Management (TBM) framework, defined by the TBM Council as a value management approach for data-driven IT decision-making, provides one structured path for building this alignment.
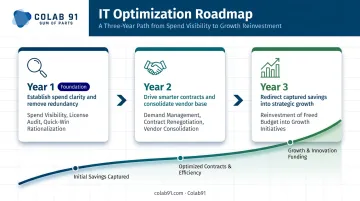
Build a multi-year optimization roadmap
Sustainable results require a programmatic approach, not an annual scramble:
| Year | Focus |
|---|---|
| Year 1 | Spend visibility, license audit, quick-win rationalization |
| Year 2 | Demand management, contract renegotiation, vendor consolidation |
| Year 3 | Reinvestment of freed budget into growth initiatives |
A one-time audit produces one-time savings. A roadmap produces compounding returns.
Build or access dedicated spend analytics capability
For mid-market and PE-backed companies, maintaining a full onshore IT spend analytics and procurement team is often cost-prohibitive. An offshore capability center model — combining strategic sourcing expertise with category-specific analytics — can deliver the continuous monitoring and systematic oversight that project-based consulting engagements rarely sustain.
Colab91 operates this model for mid-market and PE portfolio companies. The firm builds dedicated India-based teams across Technology & SaaS Procurement, spend analytics, and category management, giving clients a permanent optimization capability without the cost of expanding onshore headcount.
Engagements typically begin with a 4–6 week Savings Opportunity Assessment: mapping IT and SaaS spend, identifying consolidation opportunities, surfacing contract leakage, and benchmarking pricing against market rates. The output is a quantified roadmap that typically identifies 5–15% of addressable spend as recoverable.
PE sponsors including Carlyle Group, TPG, and Elliott have applied this model across portfolio companies — executing cross-portfolio IT and SaaS category programs that generate aggregated purchasing power no individual portfolio company could replicate on its own.
Conclusion
IT spend optimization is not about cutting investment — it is about ensuring every dollar is delivering measurable return. Organizations that treat this as a continuous discipline consistently outperform those that address it only during budget crises or at contract renewal time.
The most durable gains do not come from one-time audits. They come from building the governance structures, cross-functional alignment, and analytical capacity to manage IT spend as a strategic asset.
Whether that capability is built in-house or augmented through an offshore capability center, the operating model is what makes optimization sustainable at scale. That is the difference between a function that compounds value over time and one that resets after every budget cycle.
Frequently Asked Questions
What is the difference between IT spend optimization and IT cost reduction?
Cost reduction is a short-term, often blunt approach — cutting spend quickly, sometimes at the expense of capability. Optimization is a strategic, ongoing process focused on eliminating waste and reallocating resources toward business value. As Gartner defines it, cost optimization maximizes value and efficiency, not just the number on the expense report.
What are the biggest sources of IT spend waste in mid-market companies?
The most common culprits are unused SaaS licenses that auto-renew without review, shadow IT purchases made outside central procurement, duplicate tools bought by different business units, and cloud resources provisioned beyond actual usage needs.
How often should organizations review and optimize their IT spend?
A tiered cadence works best: monthly monitoring of usage metrics and cloud consumption, quarterly vendor and license reviews, and an annual portfolio rationalization aligned to the budget cycle. Automating monthly monitoring directly improves the quality and efficiency of quarterly and annual reviews.
What role does vendor management play in IT spend optimization?
Centralizing vendor relationships creates negotiating leverage, reduces contract overlap, and ensures renewal terms reflect actual usage. Most organizations leave material savings on the table by managing vendors reactively — approving renewals based on habit rather than utilization data or market benchmarks.
How can PE-backed companies optimize IT spend during rapid scaling?
In PE-backed environments, growth typically outpaces governance. The most effective approach combines an early spend audit to establish a baseline, clear procurement policies to curb maverick purchasing, and external analytical capacity — through a managed service or offshore capability center — to sustain discipline without over-hiring during rapid scaling.
What metrics should I track to measure IT spend optimization success?
Track IT spend as a percentage of revenue, license utilization rate (target: 90–95%), maverick spend percentage, cost per active IT seat, and procurement cycle time. These metrics are only actionable when underlying spend data is accurate, consistently classified, and refreshed in real time — not pulled manually once a year.