That clarity starts with understanding addressable spend.
This article covers what addressable spend is, how it differs from non-addressable costs, why it matters for companies under performance pressure, how to identify it across your organization, and the most effective strategies to maximize it — along with the pitfalls that derail most programs.
Organizations that actively manage their addressable spend gain sharper sourcing focus, stronger supplier leverage, and measurable EBITDA improvement. For PE-backed companies operating under value creation mandates, it's often the fastest financial lever available.
Key Takeaways
- Addressable spend = total spend minus fixed, statutory, or uncontrollable costs
- The formula: Addressable Spend = Total Spend – Non-Addressable Spend
- Top-performing procurement organizations influence up to 93% of company spend, versus 64% for peers
- Maverick and tail spend are the two biggest sources of unmanaged addressable spend
- Quarterly reviews keep spend classifications current and actionable — annual snapshots move too slowly to matter
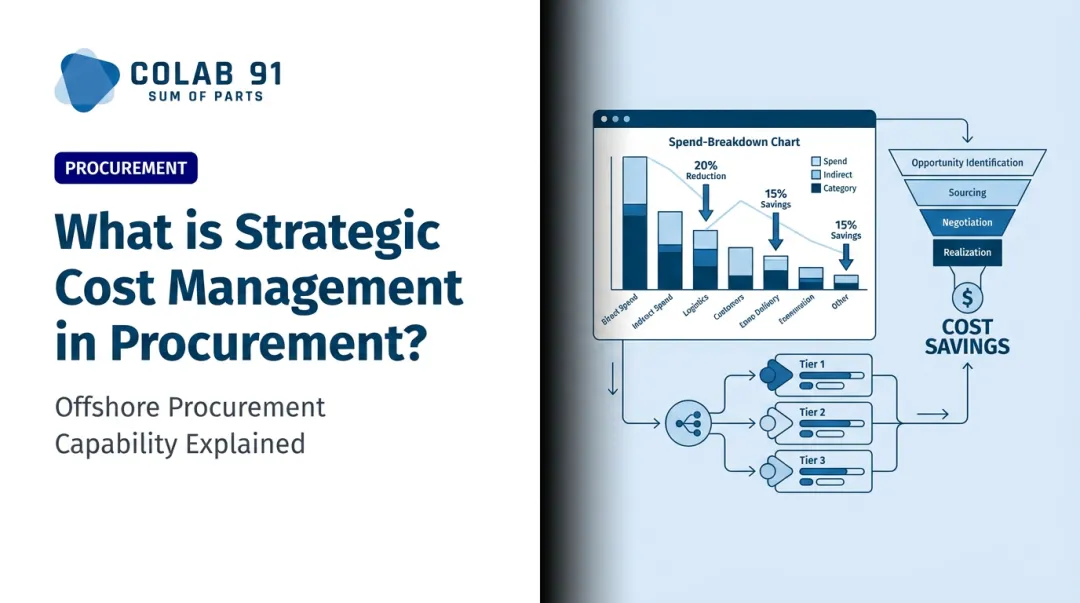
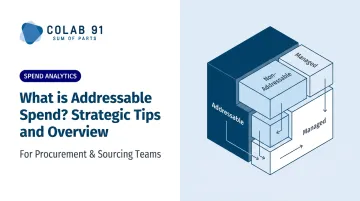
What Is Addressable Spend?
Addressable spend is the portion of an organization's total expenditure that procurement can actively influence, negotiate, or optimize. This includes decisions about which suppliers to use, what contracts to sign, how purchases are consolidated, and where competitive sourcing can drive better pricing.
It is not the same as total spend. Payroll, taxes, and regulatory obligations are real costs — they just aren't procurement levers.
Common Addressable Spend Categories
Indirect spend (typically the largest opportunity pool for services businesses):
- IT and SaaS subscriptions
- Professional services and consulting fees
- Marketing agency spend
- Office supplies and facilities
- Travel and logistics contracts
Direct spend (relevant for manufacturers and product companies):
- Raw materials where supplier competition exists
- Packaging and components
- MRO (maintenance, repair, and operating supplies)
The Basic Formula
Addressable Spend = Total Spend – Non-Addressable Spend
A simple example: if a company's total annual spend is $10M and $2M is locked into payroll-equivalent obligations and statutory fees, the addressable spend is $8M — or 80% of total spend.
That percentage varies significantly by industry. According to A&M's indirect procurement analysis, indirect spend alone ranges from 25% of revenue in healthcare services to 18.1% in industrials and manufacturing and 10.3% in business and financial services. A manufacturing firm's addressable pool centers on direct materials; a services firm's is dominated by software, professional services, and labor contracts.
Why Maverick Spend Shrinks Your Addressable Pool
Once you know your addressable spend number, the next question is whether it's shrinking without anyone noticing. Maverick — or "rogue" — spending refers to purchases made outside approved procurement channels. When a business unit buys software directly without involving procurement, that spend exits the addressable pool. It still costs money, but procurement can't touch it.
Common sources of maverick spend include:
- Departmental SaaS purchases made on corporate cards without IT or procurement review
- One-off consulting engagements approved by business unit heads outside contract frameworks
- Duplicate vendor relationships where different teams engage the same supplier independently
- Emergency buys routed around procurement due to slow approval cycles
Recovering this spend — through better visibility, clearer purchasing policy, and faster procurement response times — directly expands your actionable base without renegotiating a single existing contract.
Addressable vs. Non-Addressable Spend
The distinction matters in practice, not just on paper. Procurement teams that treat total spend as their influence perimeter end up reporting inflated savings potential — and losing credibility when those numbers don't materialize.
Non-addressable spend includes costs that are fixed, statutory, or outside procurement's authority entirely. These are accounting responsibilities, not sourcing opportunities.
| Dimension | Addressable Spend | Non-Addressable Spend |
|---|---|---|
| Definition | Spend procurement can influence or optimize | Fixed, statutory, or contractually locked costs |
| Examples | SaaS, consulting, raw materials, logistics | Payroll, taxes, regulatory fees, legal judgments |
| Control Level | Medium to high | None |
| Procurement Involvement | Active — sourcing, negotiation, contract management | None — managed by finance or legal |
| Savings Potential | Meaningful | Zero |
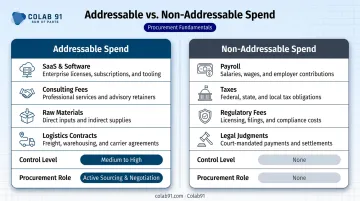
Leading frameworks reinforce these boundaries in concrete terms. The Hackett Group explicitly excludes taxes, employee base salaries and bonuses, and charitable contributions from the addressable perimeter. A&M's methodology goes further — its "topping and tailing" approach strips out non-supplier payments and out-of-scope items before addressable spend modeling begins. Teams that skip this step routinely overstate savings potential by 20–40%, which is where procurement roadmaps lose executive buy-in before sourcing work even starts.
Why Addressable Spend Matters for Mid-Market and PE-Backed Companies
Unlike revenue growth, addressable spend optimization doesn't require new customers, new markets, or extended sales cycles. It can be acted on immediately through procurement strategy — which is exactly why it's a preferred lever for PE-backed companies under tight timelines.
Kearney's 2025 procurement performance study found average annual procurement savings of 3.4%, with best performers reaching 5.5%. For PE-backed companies specifically, A&M estimates indirect procurement alone can deliver 0.4–2.0 percentage points of EBITDA uplift, with up to 70% of savings captured in year one and 20% in the first 100 days post-close.
Four Core Business Benefits
- Direct cost reduction — competitive sourcing and contract renegotiation deliver hard savings against addressable categories
- Improved budget forecasting — when controllable spend is clearly segmented, finance can model it accurately
- Stronger supplier relationships — defined procurement jurisdiction enables consistent performance management and accountability
- Reduced risk — contract compliance and vendor vetting apply where procurement has authority, not across costs it cannot control
The Finance-Procurement Alignment Requirement
Managing addressable spend isn't a procurement-only exercise. Finance-procurement alignment starts with a shared definition: what counts as addressable, and how savings are tracked against the P&L. Finance needs spend visibility for planning; procurement needs the freedom — and mandate — to act on it. Without that agreement, even well-executed sourcing initiatives won't show up on the P&L.
How to Identify Addressable Spend in Your Organization
Start with Data Consolidation
Spend identification begins with gathering purchase orders, invoices, accounts payable records, and contract data from across all departments. Fragmented data is the most common reason companies understate their addressable spend — transactions miscategorized across siloed ERP systems hide entire spend categories from procurement's view.
The goal is a single, clean spend dataset that can be analyzed at the supplier, category, department, and spend-type level.
Run a Structured Spend Analysis
Once data is consolidated, categorize all spend by:
- Supplier and spend tier
- Category (direct vs. indirect)
- Transaction type (one-time vs. recurring)
- Channel (on-contract vs. off-contract)
Pivot tables, dashboards, or dedicated spend analytics platforms can surface patterns, outliers, and year-over-year anomalies that signal unmanaged spend pools.
Colab91's AI-powered Spend Analytics platform takes this further — cleansing and classifying spend against UNSPSC or client-specific taxonomies and enriching each transaction with supplier risk, contract terms, and addressable spend percentages. The result is continuous intelligence rather than a once-a-year snapshot.
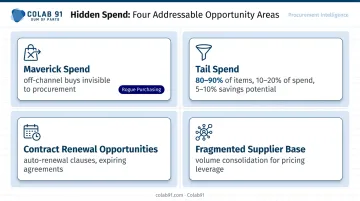
Four High-Value Areas to Examine
- Maverick spend: purchases outside approved channels or policies, invisible to procurement until they hit AP
- Tail spend: high-frequency, low-value purchases that consume disproportionate management attention. McKinsey found tail spend represents 80–90% of purchased items but only 10–20% of total spend, with 5–10% savings potential through consolidation
- Contract renewal opportunities: existing supplier agreements approaching expiry, particularly those with auto-renewal clauses that roll over without renegotiation
- Categories without preferred vendors: fragmented supplier bases where volume consolidation could yield measurable pricing leverage
Segmentation Framework
Not all spend is equally actionable. A practical framework breaks spend into three tiers:
| Tier | Description | Action |
|---|---|---|
| Fully addressable | Competitive market exists; procurement can source openly | Prioritize for competitive bid or renegotiation |
| Partially addressable | Some negotiation room; incumbent dependency or limited market | Targeted renegotiation or demand shaping |
| Non-addressable | Fixed, statutory, or operationally locked | Remove from procurement scope |
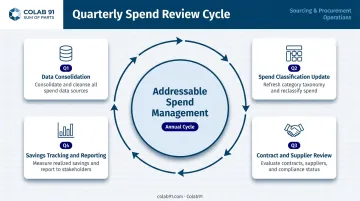
This classification should be revisited quarterly — contract terms expire, supplier markets shift, and business needs evolve. Organizations that treat it as a one-time exercise routinely find their savings pipeline eroding — not because the opportunities disappeared, but because no one was watching when the window opened.
Strategic Tips to Maximize Addressable Spend
Consolidate Your Vendor Base
Supplier fragmentation inflates unit costs and drains management bandwidth. Consolidating vendors across departments concentrates purchase volume with fewer partners, creating pricing leverage that fragmented spend simply can't generate. A Kearney PE portfolio analysis identified approximately 6% savings potential through supplier consolidation and renegotiation alone.
Lock Down Maverick Spending
Standardized procurement processes and enforced approval workflows prevent purchases from escaping the addressable spend pool. Every off-channel purchase is a missed negotiation — and a data gap that makes spend analysis less reliable.
Front-Load Contract Reviews
Engage suppliers 90–120 days before contract expiry, not at renewal. That window is where leverage lives. Identify auto-renewal clauses, benchmark current pricing against market rates, and use the competitive tension of the open market to restructure pricing tiers or consolidate overlapping agreements.
WorldCC reports average annual contract value leakage of 8.6%, with the worst performers losing 15% or more. Negotiated savings that aren't enforced at the contract and compliance level simply evaporate.
Right-Size Contracts with Usage Data
SaaS, professional services, and outsourced functions are consistently over-purchased relative to actual consumption. Flexera's 2025 State of ITAM report found that 35% of organizations reported increased SaaS waste, and complete visibility across the technology stack fell to just 43%. Usage data — not contracted volume — should drive renewal decisions.
Scale Coverage with Offshore Procurement Capacity
Mid-market companies with limited in-house procurement headcount face a structural constraint: there's more addressable spend than the team can actively manage. Categories the team can't cover stay unmanaged — and unmanaged spend doesn't get optimized.
Colab91 has built this offshore model for multiple PE-backed clients, establishing India-based teams that operate as a direct extension of the client's procurement function. Typical scope includes:
- Spend analysis and category management across indirect and direct categories
- Supplier negotiation and contract review
- Ongoing procurement analytics and savings tracking

The model shifts spend from unmanaged to actively optimized without overextending onshore headcount. Colab91's Savings Opportunity Assessment typically surfaces 5–15% of addressable spend as quantified savings within 4–6 weeks.
Common Pitfalls When Managing Addressable Spend
Poor Spend Data Quality
Incomplete, inconsistently categorized, or siloed data produces flawed addressable spend maps. Organizations relying on manual tracking or disconnected ERP systems routinely understate what's actually actionable — missing savings hiding in miscategorized transactions.
The fix: invest in data consolidation and taxonomy standardization before running spend analysis, not after. A spend analysis built on bad data generates confident-looking numbers that don't hold up in execution.
Low Organizational Buy-In
Procurement initiatives stall when finance, operations, or business unit leaders aren't aligned on goals. If stakeholders see procurement as friction rather than value, resistance will erode results — often before savings targets are even set.
Common alignment gaps include:
- No shared definition of what spend is addressable vs. committed
- Unclear ownership of approval workflows across business units
- Savings targets set by procurement without finance or operations sign-off
Transparent communication about savings targets, timelines, and cross-functional roles is not a soft skill. It's a prerequisite for realizing savings.
Treating Spend Analysis as a One-Time Event
A spend review conducted once and never updated loses accuracy within months. Contract terms expire. Business units add new vendors. Markets shift. The classifications that were accurate in Q1 may be meaningfully wrong by Q4.
Continuous monitoring — at minimum quarterly reviews, with real-time tracking for high-value categories — is how procurement teams move from identifying savings to consistently capturing them.
Frequently Asked Questions
What is addressable spend in procurement?
Addressable spend is the portion of an organization's total spend that procurement can actively control, negotiate, or optimize through sourcing strategies and supplier management. It excludes fixed or statutory costs — like taxes and payroll — that procurement has no authority to influence.
What is addressable vs. non-addressable spend?
Addressable spend includes categories procurement can act on, such as supplier contracts, software subscriptions, and professional services. Non-addressable spend covers mandatory or fixed costs outside procurement's authority — regulatory fees, employee salaries, and statutory payments.
What is an example of addressable spend?
Common examples include SaaS and software subscriptions, marketing agency fees, office supply procurement, logistics and freight contracts, and professional services engagements — categories where procurement has direct leverage to act.
How do you calculate addressable spend?
Addressable Spend = Total Spend – Non-Addressable Spend. The result is typically expressed as a percentage of total spend to benchmark procurement scope and measure program maturity over time.
What are the biggest barriers to managing addressable spend?
The top barriers are poor spend data quality, fragmented procurement processes, misalignment between procurement and finance, and limited team capacity to act on spend insights across all addressable categories.
How often should companies review their addressable spend?
At minimum, quarterly. High-value categories warrant monthly or real-time monitoring. Addressable spend classifications change as contracts expire, business needs evolve, and new spend categories emerge — annual reviews simply can't keep pace.