According to CSCMP's 2025 State of Logistics Report, U.S. business logistics costs reached $2.3 trillion, equivalent to 8.7% of GDP. For manufacturers, McKinsey research shows inbound freight alone typically represents 8% to 12% of total raw-material spend — a category most companies have never analyzed at the lane level.
A freight spend analysis changes that. It gives logistics and procurement leaders visibility into exactly where freight dollars are going, which cost drivers are controllable, and where carrier leverage exists. This guide walks through how to do it right.
Key Takeaways
- Freight spend analysis is a structured review of all transportation costs across modes, carriers, lanes, and time periods to surface inefficiencies and savings.
- Clean, consolidated data from invoices, TMS/ERP systems, and carrier contracts is the foundation; gaps in that data will undercount your true spend.
- The process follows six stages: define scope, gather data, categorize and clean, analyze, benchmark, and act.
- Core KPIs to track: cost per shipment, freight cost as a percentage of revenue, cost per mile, and accessorial charge rate.
- Freight spend analysis delivers value only when it becomes a recurring capability, not a one-time project.
What Is Freight Spend Analysis?
Freight spend analysis is a systematic review of a company's transportation and logistics expenditures over a defined period. It covers all modes — truckload (TL), less-than-truckload (LTL), parcel, intermodal, ocean — across carriers, lanes, and cost categories, with the goal of identifying inefficiencies, billing errors, and cost reduction opportunities.
How It Differs from Freight Audit and Payment
These two disciplines are often conflated, but they serve different purposes:
| Freight Audit & Payment (FAP) | Freight Spend Analysis | |
|---|---|---|
| Focus | Invoice accuracy and payment processing | Strategic spend patterns and cost reduction |
| Output | Billing error recovery | Carrier mix, lane optimization, benchmarking |
| Cadence | Transactional (per invoice) | Periodic or continuous |
| Value | Recover overbillings | Build a smarter procurement strategy |
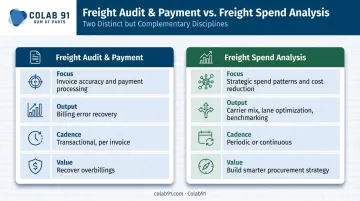
FAP is a necessary operational control. Freight spend analysis is the strategic layer on top. It goes beyond invoice accuracy to ask whether the company is spending wisely — and where the structural inefficiencies are hiding.
Approaches Vary Widely
Companies handle this differently depending on their procurement and data maturity:
- Manual/spreadsheet-based reviews using exported invoice data
- TMS-native reporting that surfaces operational metrics but rarely strategic insight
- Technology-driven analytics platforms with unified data layers and spend classification
- Outsourced analytics teams with dedicated freight and procurement expertise
The sophistication of the approach directly determines the quality of insights produced. A spreadsheet review will catch duplicate invoices. A structured analytics program will identify that a carrier on a specific lane is charging 20% above market, giving procurement teams concrete data to bring to carrier negotiations.
Why Freight Spend Analysis Is Critical for Your Business
Without a structured analysis, companies overpay through a combination of forces that compound silently: unchallenged billing errors, suboptimal carrier selection, unmanaged accessorial charges, and lane fragmentation that prevents consolidation. None of these problems announce themselves on a P&L.
McKinsey research found that companies applying a structured inbound-freight analysis can typically achieve 5% to 10% savings on baseline freight costs. For a business spending $10 million annually on freight, that's $500,000 to $1 million in recoverable spend.
Core Business Benefits
- Uncovers hidden costs — accessorial charges, fuel surcharge creep, and duplicate billing that reactive management never catches
- Creates negotiation leverage — data-backed evidence of rate variance and carrier performance replaces gut-feel contract discussions
- Reduces freight cost drag on working capital, with a direct impact on cash-to-cash cycle performance
- Supports mode shifts, lane consolidation, and carrier rationalization decisions — all defensible with data
- Gives mid-market CFOs and PE operating partners quantified freight savings to demonstrate measurable cost transformation
McKinsey's 2023 survey of 258 global logistics leaders found that 68% of shippers cited cost as their primary challenge in transportation management. Companies that address it structurally — not reactively — consistently outperform peers on freight cost per unit shipped. The sections below show exactly how to get there.
How to Conduct a Freight Spend Analysis: Step by Step
This section breaks the process into six practical stages that mirror how experienced procurement and logistics teams execute it — and flags what commonly goes wrong at each.
Step 1 — Define Scope and Objectives
Before pulling a single data file, align on what the analysis will actually cover:
- Modes included: TL, LTL, parcel, ocean, intermodal, air freight
- Geographies: domestic only, or cross-border and international lanes
- Time period: 12 months minimum; 24 months preferred to capture seasonality
- Cost categories: base freight, fuel surcharges, accessorials, customs, claims, miscellaneous fees
Equally important: align on the objective. The goal shapes everything downstream.
- Carrier rationalization → prioritize spend concentration and lane overlap analysis
- Contract renegotiation prep → focus on rate benchmarking and contract compliance
- Mode optimization → model LTL-to-TL consolidation opportunities
- Baseline cost visibility → comprehensive spend cube across all dimensions
Without a clear scope and objective, teams spend weeks producing data that no one acts on.
Step 2 — Gather and Consolidate Data
The core data sources required:
- Carrier invoices (all modes, full period — not a sample)
- TMS and ERP exports (shipment records, PO-level data)
- Carrier contracts and rate cards
- Bill of lading data
- Accessorial charge logs
- Fuel surcharge schedules by carrier
Data fragmentation is the most common obstacle at this stage. Freight data often lives across three or four systems — a TMS, an ERP, a carrier portal, and a spreadsheet someone maintains manually. Consolidating these into a single analysis-ready dataset is unglamorous work, but skipping it creates blind spots.
One critical rule: audit 100% of invoices, not a sample. Billing error patterns concentrate in specific carriers, lanes, and charge types — sampling systematically misses the worst offenders.
Freight invoice error rates typically run 5%–30%, with the highest rates in contracts carrying complex accessorial schedules. That range is wide enough that a sample-based audit will consistently undercount recoverable overpayments.
Step 3 — Categorize and Clean the Data
Structure costs into logical buckets:
- Base transportation charges (linehaul)
- Fuel surcharges (indexed to carrier schedules)
- Accessorial fees — residential delivery, liftgate, inside delivery, redelivery, notifications, storage
- Customs and duties (for international lanes)
- Claims costs
- Miscellaneous fees
This categorization reveals which cost buckets are driving spend — and often surprises procurement leaders. Accessorial charges in particular tend to be underestimated until they're isolated and measured as a share of total freight spend.
Data cleaning is non-negotiable: remove duplicates, standardize carrier names and lane codes, correct mis-coded freight classes. Dirty data produces flawed conclusions and missed savings. The effort here directly determines the quality of everything that follows.
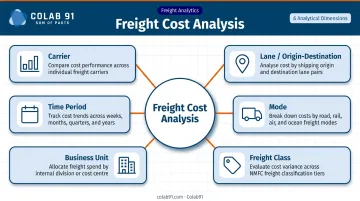
Step 4 — Analyze Cost Drivers and Patterns
Run cost analysis across multiple dimensions simultaneously:
- By carrier — spend concentration, rate trends, billing compliance
- By lane (origin-destination pair) — highest-cost lanes, single-carrier dependency
- By mode — TL vs. LTL vs. parcel split and cost-per-unit comparison
- By freight class — misclassification patterns that inflate costs
- By business unit or product line — where freight cost burden falls internally
- By time period — seasonality, rate escalation trends, accessorial spikes
Apply both descriptive analytics (what happened) and diagnostic analytics (why it happened). A spike in accessorial charges at a specific carrier warrants a different response than an industry-wide fuel surcharge increase. Root cause matters because the right response to a billing pattern at one carrier is rarely the same as the right response to a market-wide cost shift.
McKinsey documented a case where the same material, shipped on an identical lane with the same supplier, cost 20% more from one origin point than another. That gap only surfaced through lane-level analysis.
Step 5 — Benchmark Against Market and Contracts
Two benchmarking layers are required:
Internal benchmarking (rate leakage): Compare actual invoiced rates against contracted rates to identify where carriers are billing above contract, where off-contract shipments are occurring, and where negotiated discounts aren't being applied consistently.
External benchmarking (market rates): Compare contracted rates against current market pricing to determine whether your rates reflect competitive market conditions. This is where negotiation leverage lives.
Current market data illustrates why this matters: FreightWaves reports the truckload contract premium compressed from $0.39/mile in March 2025 to $0.11/mile by March 2026 as spot rates rose faster than contract rates. Companies that benchmarked their contracts against market data during this period could identify where to push back — or where contracts provided genuine value worth protecting.
That $0.28/mile compression is only visible — and actionable — if you're tracking market rates alongside your contracted rates.
Step 6 — Generate Insights and Build an Action Plan
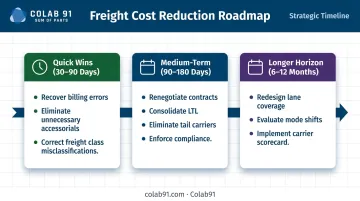
Translate findings into a prioritized action plan ranked by estimated savings impact and implementation complexity:
Quick wins (30–90 days):
- Recover billing error overpayments
- Eliminate unnecessary accessorial charges through carrier policy alignment
- Correct freight class misclassifications
Medium-term initiatives (90–180 days):
- Renegotiate carrier contracts using benchmark data
- Consolidate LTL shipments to reduce per-unit costs
- Eliminate tail carriers with minimal volume and no strategic rationale
- Enforce contract compliance across high-volume lanes
Longer-horizon initiatives (6–12 months):
- Redesign lane coverage and carrier mix
- Evaluate mode shift opportunities (LTL to TL, parcel to LTL)
- Implement a carrier scorecard and ongoing performance monitoring framework
Establish a KPI dashboard and monitoring cadence before closing out the analysis. Freight spend analysis that doesn't close the loop with measurable follow-up rarely delivers its projected value.
Freight Spend Analysis in Practice: A Walkthrough
Consider a mid-market manufacturer running a structured freight spend analysis for the first time. After consolidating invoice data from their TMS, ERP, and three carrier portals, the analysis surfaces two findings that wouldn't have appeared in any existing report:
Finding 1: 30% of parcel spend is concentrated with a single carrier on lanes where two competitive alternatives operate. The carrier's rates haven't been benchmarked against market in over two years.
Finding 2: Accessorial charges — primarily liftgate fees and residential delivery surcharges — represent a higher share of total freight cost than the team expected. Several charges are billing consistently on accounts where the service isn't being requested.
The team avoided the most common mistakes:
- They audited 100% of invoices, not a sample — which is how the accessorial billing pattern surfaced
- They consolidated data from three separate systems before analyzing, preventing incomplete lane-level conclusions
- They benchmarked carrier rates against current market data before entering negotiations, giving them credible leverage
Outcome: a carrier mix adjustment on the concentrated parcel lanes, renegotiated base rates backed by market data, and a revised accessorial policy with carrier compliance requirements built into the new contracts.
The findings fed directly into a quarterly freight spend review process: monthly KPI monitoring, quarterly benchmarking refreshes, and annual contract cycle preparation — all built into the operating model. What started as a one-time diagnostic became a repeatable, structured capability.
How Colab91 Can Help Build Your Freight Analytics Capability
For mid-market and PE-backed companies that recognize the value of ongoing freight spend analysis but lack the internal bandwidth to execute it consistently, the constraint is rarely strategic clarity — it's analytical capacity.
Colab91 builds dedicated, India-based offshore analytics teams for exactly this challenge. Rather than delivering a one-time analysis, the model stands up a continuous freight and procurement analytics capability that integrates with existing TMS and ERP systems, maintains clean data pipelines, and delivers decision-ready insights to procurement and supply chain leaders on a weekly or monthly cadence.
That capability combines Colab91's AI-powered spend analytics platform — handling data cleansing, taxonomy classification, and spend enrichment — with dedicated human analysts who bring category expertise to freight-specific questions:
- Carrier negotiation strategy and rate benchmarking
- Accessorial charge identification and dispute resolution
- Lane optimization modeling across modes and regions
- Contract compliance monitoring and variance tracking

Leadership draws on 16+ years of experience scaling offshore procurement and analytics organizations at Impendi (acquired by Accenture). The client roster includes Carlyle Group, TPG, Kindred Healthcare, and Veolia — organizations where freight and logistics represent meaningful spend categories within broader indirect spend programs.
Within PE portfolio contexts, Colab91 positions freight spend analysis as a category-level workstream inside an integrated indirect spend program. Cross-portfolio carrier leverage — aggregating freight volume across multiple portfolio companies — consistently produces negotiating outcomes that no single company effort can replicate.
Companies that embed freight analytics into their operating rhythm — rather than treating it as a one-off exercise — capture savings that reactive programs routinely miss. If your team is ready to explore what a dedicated offshore freight analytics capability could look like, connect with Colab91 at contact@colab91.com.
Frequently Asked Questions
What is the KPI for freight spend?
Core freight spend KPIs include freight cost as a percentage of revenue, cost per shipment, cost per mile, accessorial charge rate, on-time delivery rate, and carrier invoice accuracy rate. APQC benchmarks outbound freight cost at a median of $1.09 per $1,000 of revenue across 1,611 organizations. The right KPIs depend on your specific objectives — carrier performance, cost reduction, or network optimization each prioritize different metrics.
How do you analyze freight costs?
Start by consolidating invoice and shipment data across all carriers and modes into a single dataset. Categorize costs by type (base freight, fuel, accessorials) and lane. Apply descriptive analytics to identify spend patterns and diagnostic analytics to trace root causes. Benchmark actual costs against contracted rates and current market data to surface the most meaningful savings opportunities.
What is the difference between freight audit and freight spend analysis?
Freight audit validates invoice accuracy and recovers overbillings. It's a transactional control. Freight spend analysis is a broader strategic exercise examining spend patterns, carrier mix, lane efficiency, mode optimization, and cost reduction opportunities across the entire transportation network — one operates at the invoice level, the other at the strategy level.
How often should a company conduct a freight spend analysis?
Most companies benefit from a full freight spend analysis annually, typically aligned with carrier contract renewal cycles. Supplement this with quarterly or monthly KPI monitoring to catch emerging cost trends — accessorial spikes, rate creep, or carrier compliance issues — before they compound.
What data sources are needed for a freight spend analysis?
Key inputs include carrier invoices, TMS and ERP shipment records, carrier rate cards and contracts, accessorial charge logs, fuel surcharge schedules, and bill of lading data. The completeness and cleanliness of this data directly determines the quality of insights produced — partial data from sampled invoices or a single system creates blind spots that systematically underestimate true freight spend.
How can companies reduce freight costs after completing a spend analysis?
After completing an analysis, focus on these actions: renegotiate carrier contracts using market benchmark data, consolidate LTL shipments to reduce per-unit costs, eliminate unnecessary accessorial charges through revised carrier policies, optimize mode mix where lane characteristics support a shift, and recover billing error overpayments. Prioritize each by estimated savings impact relative to implementation effort.