Spend cube analysis solves this by organizing procurement data across three simultaneous dimensions - supplier, category, and business unit - so teams can interrogate spend from every angle rather than one flat report at a time.
This article covers what a spend cube is, why it matters, how the four-stage process works, and includes a practical Power BI walkthrough you can apply directly.
Key Takeaways
- A spend cube maps procurement data across three axes: who you're buying from, what you're buying, and who is doing the buying
- Ardent Partners found organizations with automated spend analysis are 87% more likely to use data for sourcing decisions
- Quality of insight depends on four stages: collect, cleanse, categorize, and analyze - in that order
- Power BI can build a functional spend cube using Excel data, star schema modeling, and DAX measures
- Key outcomes: supplier consolidation, maverick spend reduction, price standardization, and contract renegotiation leverage
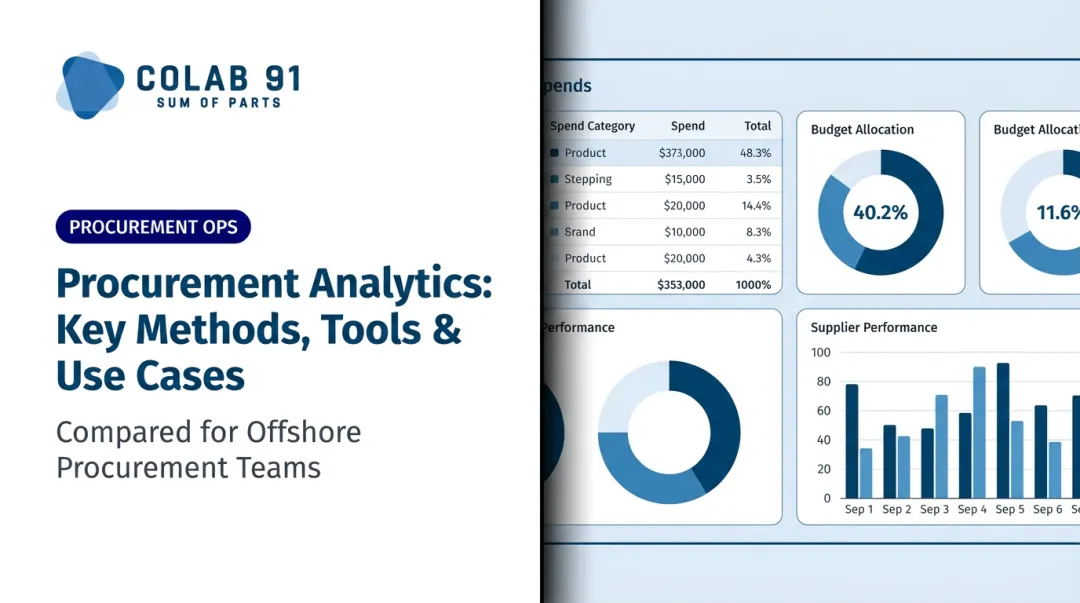
What Is Spend Cube Analysis?
Spend cube analysis is a method for visualizing and analyzing procurement expenditure across multiple dimensions simultaneously. Rather than viewing spend as a flat list of transactions, it presents data as a three-dimensional matrix - each axis representing a distinct lens on organizational buying behavior.
The term "cube" reflects how data can be sliced in multiple directions at once. A standard pivot table shows you one cut of the data. A spend cube lets you rotate, filter, and cross-reference dimensions interactively - surfacing patterns that single-dimension reports simply cannot reveal.
The Three Dimensions of a Spend Cube
Every spend cube is built on three core axes:
- Supplier: who you're buying from
- Category/Commodity: what you're buying
- Business Unit / Cost Center: who within the organization is spending
These dimensions are interdependent. Remove one and the analysis collapses into a basic report. Their intersection is where savings opportunities become visible.
A concrete example: analyzing IT software purchases (category) across European offices (business unit) from enterprise vendors (supplier) might reveal that three regional teams each hold separate licenses for the same tool at different price points - a consolidation opportunity invisible from any single-dimension report.
Spend Cube vs. Basic Spend Reporting
| Feature | Standard Spend Report | Spend Cube |
|---|---|---|
| Dimensions | Single | Three simultaneous |
| Interactivity | Static | Filterable, sliceable |
| Pattern recognition | Limited | Cross-dimensional |
| Savings identification | Reactive | Proactive |
| Typical output | Spreadsheet / flat table | Interactive dashboard |
The table above captures the structural difference. What it doesn't show is the practical shift in how procurement teams work - moving from reporting what happened to actively finding where to act next.
Why Spend Cube Analysis Matters
Without structured spend visibility, procurement teams can't identify supplier fragmentation, pricing inconsistencies, or off-contract buying until the damage is already done.
Ardent Partners research makes the performance gap concrete: Best-in-Class procurement teams managed 89% of their spend versus just 54% for peers - and achieved savings rates of 7.8% vs. 6.7%. That gap traces directly to spend visibility.
The Hackett Group adds another dimension: Digital World Class procurement functions experience 59% less savings loss from maverick buying and contract noncompliance compared to typical organizations.
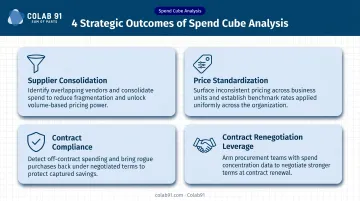
Four Strategic Outcomes Spend Cube Analysis Enables
- Supplier consolidation: Reveals when multiple departments buy from redundant vendors for equivalent goods - a clear signal to rationalize the supplier base.
- Price standardization: Exposes unit price variances across cost centers buying identical items, giving negotiators a direct target.
- Contract compliance: Pinpoints which business units consistently buy outside preferred agreements, surfaced through multi-dimensional analysis.
- Contract renegotiation leverage: Identifies suppliers with significant spend across multiple categories, building a data-backed case for volume-based renegotiation.
These tactical wins compound into broader strategic value. Spend cube analysis also underpins category management strategy, strengthens supplier relationship management, and gives finance and procurement a single, reconciled view of spend data to plan from.
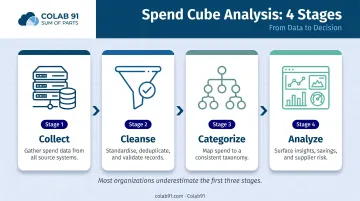
How Spend Cube Analysis Works: The 4-Stage Process
CIPS defines spend analysis as collecting, classifying, and analyzing expenditure data. APQC's Process Classification Framework breaks this into four stages: collect, cleanse, classify, and analyze. Most organizations underestimate the first three - that's where insight quality is actually decided.
Step 1 – Collect
Extract procurement transaction data from every available source:
- ERP systems (SAP, Oracle, etc.)
- Purchase orders and blanket agreements
- P-card and corporate card files
- Accounts payable exports
Each record should capture: supplier name, transaction amount, date, cost center, commodity code, and contract reference where available. Breadth of coverage matters - gaps at this stage create blind spots in the final cube.
Step 2 – Cleanse
Raw data is rarely clean. Common issues include:
- Inconsistent supplier names ("IBM Corp" vs. "IBM Corporation" vs. "IBM")
- Duplicate transactions from multiple system exports
- Missing cost center assignments
- Formatting errors in amounts or dates
This is typically the most labor-intensive stage - and where errors in the final spend cube originate. Automating portions of this process (fuzzy matching for supplier names, validation rules for amounts) cuts manual effort.
Step 3 – Categorize
Map every transaction to a standard taxonomy. UNSPSC is a widely used global classification system with four levels:
- Segment - broadest category (e.g., IT products and services)
- Family - functional grouping (e.g., computers)
- Class - product/service type (e.g., laptops)
- Commodity - specific item
Custom hierarchies work equally well, provided they're applied consistently across all business units. If one division codes "laptop purchases" under IT Hardware and another under Office Equipment, cross-dimensional analysis breaks down entirely.
Step 4 – Analyze
Transform cleansed, categorized data into interactive dashboards that surface:
- Savings opportunities by supplier and category
- Compliance gaps by business unit
- Supplier concentration and risk exposure
- Spend trends over time
At this stage, transaction data stops being a record of what happened and starts informing what to do next - which contracts to renegotiate, which suppliers to consolidate, and where maverick spend is eroding savings targets.
Building a Spend Cube in Power BI: A Practical Walkthrough
Power BI works well for procurement teams building spend cube analysis - it handles multi-dimensional data modeling without requiring a dedicated BI developer. This walkthrough uses Excel as the data source.
Step 1 – Prepare Your Data in Excel
Set up four structured tables in Excel, formatted using Ctrl+T:
| Table | Key Fields |
|---|---|
| Suppliers | SupplierID, SupplierName |
| Cost Centers | CostCenterID, CostCenterName |
| Commodities | CommodityID, CommodityName |
| Transactions | TransactionID, SupplierID, CostCenterID, CommodityID, Amount, Date |
The Transactions table is your fact table. The other three are dimension tables. Keep data clean before import - errors here propagate through every downstream visual.
Step 2 – Import Data and Build Relationships in Power BI
- Open Power BI Desktop → Get Data → Excel Workbook
- Select all four tables and load them
- Navigate to Model View
- Draw relationships between Transactions and each dimension table using the shared ID fields (SupplierID, CostCenterID, CommodityID)
This star schema structure connects one fact table to multiple dimension tables, enabling cross-dimensional filtering across your entire dataset. Microsoft's guidance on star schema design covers this pattern in detail.
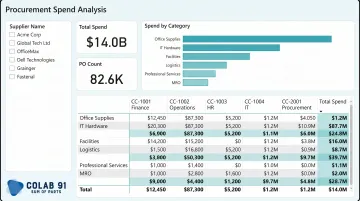
Step 3 – Create the Spend Cube Visualizations
Create your core measure using DAX:
Total Spend = SUM(Transactions[Amount])
Build the spend matrix:
- Insert a Matrix visual
- Set CommodityName as Rows
- Set CostCenterName as Columns
- Set Total Spend as Values
This gives you category spend broken down by business unit - the core spend cube view.
For interactive filtering, insert a Slicer visual connected to SupplierName. Select any supplier and the matrix instantly updates to show that supplier's spend by category and cost center.
Additional report pages can show Spend by Supplier (bar chart) and Spend by Cost Center (treemap) for complementary views.
Additional report pages can show Spend by Supplier (bar chart) and Spend by Cost Center (treemap) for complementary views.
Step 4 – Publish, Share, and Schedule Refreshes
- Click Publish to push the report to Power BI Service
- Pin key visuals to a shared dashboard for stakeholder access
- Set up scheduled data refresh to keep the spend cube current as new transactions arrive
Microsoft also provides a downloadable Procurement Analysis sample report with pre-built visuals analyzing spend by category, location, and vendor tier - a useful reference for teams building their first spend cube.
How Colab91 Can Help
Building a spend cube is one thing. Maintaining it, improving it, and acting on it consistently is where most mid-market and PE-backed companies run into trouble - especially when dedicated procurement analytics headcount simply isn't there.
Colab91 builds India-based analytics teams with deep domain expertise in spend analysis, category management, and strategic sourcing. Managing Partner Madhur Kabra - former Country Head of Impendi India, acquired by Accenture - has run spend analytics programs at scale for PE sponsors including Carlyle Group and TPG.
That operational history shapes how Colab91's teams work: analysts come in with procurement context, not just spreadsheet skills.
Colab91's "Sum of Parts" model pairs a client's in-house procurement team with offshore analysts who handle the data-intensive work of spend cube development:
- Collecting and consolidating spend data from ERP and AP systems
- Cleansing and normalizing supplier records
- Categorizing spend against a consistent taxonomy
- Building and maintaining Power BI (or equivalent) dashboard reporting
Senior procurement leaders get the insights they need to act - without spending their time producing them.
For PE portfolio companies that need spend visibility fast after an acquisition, or mid-market teams building analytics capability for the first time, this model delivers analyst depth at offshore economics - without the cost or timeline of a full internal hire-up.
Frequently Asked Questions
What is a spend cube analysis?
Spend cube analysis is a multi-dimensional method for organizing procurement spend data across three axes - suppliers, categories, and business units. It is the structured output of a spend analysis process, designed to surface savings opportunities and sourcing patterns that single-dimension reports cannot reveal.
What is an example of a spend analysis?
A company discovers through spend cube analysis that five departments are each purchasing office supplies from separate vendors at different prices. Procurement consolidates to one preferred supplier and negotiates a volume discount - a savings opportunity only visible once all three dimensions are examined together.
What are the three dimensions of a spend cube?
The three axes are:
- Supplier - who you're buying from
- Category/Commodity - what you're buying
- Business Unit/Cost Center - who is doing the buying
Each dimension intersects with the others to reveal procurement patterns no single-axis report can show.
How is a spend cube different from a regular spend report?
A standard spend report is typically single-dimensional and static - it shows totals by one variable at a time. A spend cube enables simultaneous multi-dimensional analysis, letting users filter by supplier and instantly see category and cost center breakdowns in the same view.
What tools can you use to build a spend cube?
Excel pivot tables work for small datasets. Power BI and Tableau handle larger, more visual analysis. Dedicated spend analytics platforms (such as those offered by JAGGAER or SpendHQ) provide automation and automated spend classification for large, complex organizations.
How often should organizations update their spend cube?
Monthly updates are standard for active procurement programs. Smaller organizations can often work well on quarterly or annual cycles. Power BI's scheduled refresh can push this closer to real-time as new transaction data flows in.