Introduction
For most enterprises, external spend — payments to suppliers, vendors, partners, and service providers — represents 40 to 70 percent of total costs, according to Deloitte. Yet despite this scale, it routinely receives operational treatment rather than strategic scrutiny.
The mismatch is expensive. Companies run annual sourcing cycles, auto-renew contracts without market-testing, and let employees buy outside approved channels — all while leaving material savings on the table. For CFOs and CPOs at mid-market and PE-backed companies, this is the single most actionable cost lever available, and one that requires no headcount reductions or capital restructuring to pursue.
This guide walks through the full picture: how to categorize external spend, why it's structurally hard to control, a five-step optimization framework, and the KPIs that prove results.
Key Takeaways
- External spend encompasses all third-party payments and typically accounts for 40–70% of total organizational costs
- Sustainable savings require treating external spend as a strategic asset, not just a cost line
- A structured approach covering visibility, governance, and supplier engagement delivers durable results
- KPIs like Spend Under Management, contract compliance rate, and cost savings vs. avoidance are the essential scorecard metrics
What Is External Spend?
External spend covers all expenditure flowing to third-party suppliers, vendors, partners, and service providers. It's distinct from internal labor costs, depreciation, and capital investments. In practice, this includes raw materials, IT infrastructure, logistics, consulting, marketing services, and everything in between.
What makes external spend uniquely actionable is its negotiability. Unlike fixed internal costs — salaries, leases, depreciation — external spend can be renegotiated, consolidated, re-tendered, or restructured, often with material financial impact and without a single headcount reduction.
McKinsey has described rapid procurement transformation as one of the fastest ways to improve cash flow, and for good reason: external spend runs 30–70% of total expenditure in many organizations, making it the single largest lever available to most finance and procurement teams.
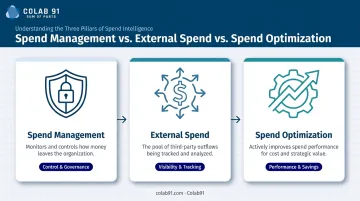
Three related terms worth distinguishing:
- Spend management monitors and controls how money leaves the organization — policies, approvals, systems, and visibility
- External spend is the specific pool of third-party outflows that spend management tracks
- Spend optimization actively improves that pool: cutting costs, lifting supplier performance, and aligning every dollar to strategic priorities
That last distinction matters most for ownership. Spend optimization belongs on the CFO's agenda alongside the CPO's — because the financial impact is too significant to treat as a back-office function.
Categories of External Spend: What You Are Actually Managing
Direct vs. Indirect Spend
Direct spend ties directly to producing a product or delivering a service: raw materials, contract manufacturing, direct logistics. It's visible, measurable, and typically already under some form of procurement governance.
Indirect spend keeps the business running but doesn't flow into the end product — IT, professional services, facilities, HR, marketing, travel. It's more fragmented, harder to govern, and where the largest optimization gaps tend to exist in mid-market organizations.
The indirect category is where most companies leave money on the table. Spend is distributed across dozens of departments, managed by budget owners who prioritize speed over price, and rarely benchmarked against market rates.
Tail Spend and Maverick Spend
Tail spend refers to the large volume of low-value transactions that collectively account for a disproportionate share of purchase activity. According to the Hackett Group's 2025 Tail Spend Management Study, tail spend represents 20% of enterprise spend value spread across 80% of suppliers — and only 4% of companies actively manage most of it. A further 64% of procurement leaders report dissatisfaction with their current tail spend approaches.
Left unmanaged, tail spend creates downstream problems that compound quickly:
- Supplier proliferation that increases vendor management overhead
- Inflated per-transaction costs from one-off purchases outside contracted rates
- Spend data too fragmented to analyze or benchmark
Maverick spend — purchases made outside approved procurement channels and contracts — compounds these problems further. It erodes negotiated savings, increases compliance risk, and corrupts the spend data your team relies on to make decisions.
Its more extreme variant, dark spend, covers transactions the organization doesn't even know occurred: ad-hoc software subscriptions, off-channel travel bookings, individual department purchases that never touch a purchase order. Until you run a structured spend analysis, both categories stay hidden — and the cost of inaction accumulates quietly in the background.
Why Optimizing External Spend Is Harder Than It Looks
The Distributed Decision-Making Problem
Spend decisions are made by hundreds, sometimes thousands, of individuals across functions — each optimizing for their own deadlines, budgets, and success metrics.
A project lead needs a vendor approved by Friday. A business unit head is protecting margin. A procurement team is measured on documented savings. These incentives frequently conflict, and without governance, local optimization consistently overrides enterprise value creation.
No policy document fixes this. What fixes it is a governance model that aligns incentives, information, and intent — so strategically sound decisions happen naturally rather than requiring constant enforcement.
The Strategy-Spend Misalignment Problem
In mid-market and PE-backed companies, leadership often believes the organization is investing in digital transformation or operational efficiency. The spend data tells a different story. The majority of external budget tends to be locked in multi-year legacy contracts with vendors that no longer represent best value — signed years before the current strategy existed.
Consider a mid-market manufacturer that acquires two businesses over three years. Each entity brings its own ERP system, its own preferred suppliers, and its own informal purchasing norms. By the time the integration settles, the combined entity has 400 active suppliers across categories where 40 would suffice — and no one has the spend data to prove it, much less renegotiate it.
Structural Barriers Specific to Mid-Market and PE-Backed Companies
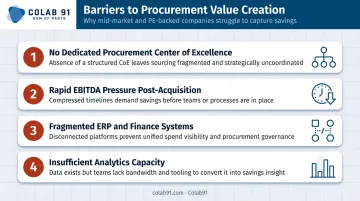
Mid-market organizations face compounding challenges that enterprise companies with mature procurement functions don't:
- No dedicated procurement center of excellence
- Pressure for rapid EBITDA improvement post-acquisition, with limited time to build internal capability
- Fragmented ERP and finance systems that make spend aggregation difficult
- Insufficient analytical capacity to process and act on spend data at category level
These barriers are precisely why the approach matters as much as the intent. Organizations that close the analytical and capability gap — through dedicated spend analytics, category expertise, or offshore procurement teams — move from diagnosing the problem to acting on it.
How to Build an External Spend Optimization Strategy: 5 Key Steps
Step 1 – Achieve Full Spend Visibility
No optimization is possible without a unified, accurate picture of where money is going. That means aggregating spend data from ERP systems, AP records, P-cards, corporate card platforms, contract repositories, and invoice archives into a single consolidated view.
Raw transaction data is messy. Supplier names are inconsistent across systems — the same vendor appears as "ABC Corp," "A.B.C. Corporation," and "American Business Company" in three different ERP records. AI-powered spend classification tools can accelerate normalization and categorization, but the data enrichment work still requires domain expertise to ensure classifications are accurate at the category level.
Colab91's spend analytics platform, for example, takes this further by enriching cleansed spend data with:
- Supplier diversity and ESG ratings
- Risk profiles and contract terms
- Addressable spend percentages by category
- Standardized UNSPSC or client-specific taxonomy classifications
The output is a spend cube built for actual decision-making, not just reporting.
Step 2 – Categorize and Prioritize Spend
Once spend is visible, segment it by supplier, category, business unit, and geography. The goal is identifying where the largest optimization levers sit.
The concentration pattern is consistent across organizations: a small number of categories and suppliers typically account for the vast majority of external spend. ISM's data confirms the 80/20 pattern — roughly 80% of spend concentrated among the top 20% of suppliers — which establishes a clear prioritization logic.
Start where spend is largest and contracts are most negotiable. Don't begin with tail spend rationalization when strategic sourcing events in IT, logistics, or professional services could generate ten times the impact in the same timeframe.
Step 3 – Establish a Governance Framework
Effective governance isn't about adding bureaucratic friction. It's about designing an environment where strategically sound decisions happen naturally.
In practice, this means:
- Approval thresholds tied to spend level, not just purchase category
- Category ownership — clear accountability for who manages which spend areas
- Purchasing policies that channel spend through approved suppliers and pre-negotiated contracts
- Escalation protocols for exceptions, with enough transparency to identify where leakage is occurring
The goal is making compliant purchasing the path of least resistance, not a compliance burden that business units work around.
Step 4 – Engage Suppliers Strategically
Spend data transforms supplier negotiations from reactive bargaining into evidence-based strategic engagement. With a clean spend picture, procurement teams can:
- Benchmark current prices against internal and external market rates
- Model volume consolidation scenarios across business units or acquired entities
- Evaluate total cost of ownership rather than unit price alone
- Use supplier performance scorecards to tie commercial terms to delivery outcomes
Not every supplier warrants the same approach. Strategic suppliers merit deeper partnership investment, where the value generated goes well beyond price. Transactional suppliers are primarily a price efficiency exercise. That distinction should drive how negotiation resources are allocated.
For mid-market and PE-backed companies without in-house strategic sourcing capacity, an offshore capability center can close that gap without building permanent headcount. Colab91's model deploys dedicated India-based category managers and analysts who own specific spend categories end-to-end: category strategy, sourcing execution, negotiation, contract management, and supplier performance tracking — at a fraction of equivalent in-house hiring costs.
Step 5 – Track, Iterate, and Sustain Optimization
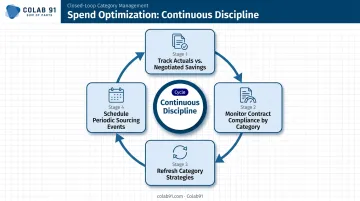
External spend optimization delivers results only when it's managed as an ongoing discipline, not treated as a one-time diagnostic.
The closed-loop discipline requires:
- Track actuals vs. negotiated savings — verify that contracted savings are materializing in actual spend
- Monitor contract compliance rates by category and business unit
- Refresh category strategies as market conditions evolve
- Schedule periodic sourcing events for key categories rather than defaulting to auto-renewal
Organizations that embed this rhythm outperform peers on third-party cost management over time. The ones that don't tend to discover, three years later, that their negotiated savings existed only on paper.
Key Levers to Reduce and Optimize External Spend
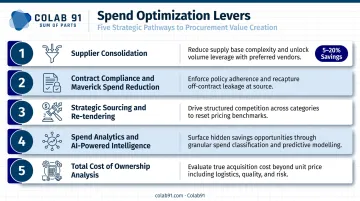
Five levers consistently drive the most measurable impact across spend optimization programs — from quick compliance wins to structural sourcing improvements.
Supplier consolidation — Fragmented supplier bases dilute negotiating leverage, inflate transaction costs, and increase vendor management overhead. Consolidating to a preferred supplier panel concentrates volume, improves pricing, and reduces compliance risk. Deloitte estimates strategic sourcing programs can deliver 5–20% savings on addressed spend categories.
Contract compliance and maverick spend reduction — Improving contract utilization captures savings that have already been negotiated but are being lost to off-channel purchasing. Research cited by Sievo, drawing on Hackett Group data, suggests organizations can lose up to 16% of negotiated savings when employees buy outside approved agreements. Purchasing policies, automated approval workflows, and spend visibility dashboards close this gap without overburdening employees.
Strategic sourcing and competitive re-tendering — Auto-renewing supplier contracts without market testing is one of the most common sources of cost leakage. Regularly running competitive sourcing events for major spend categories forces market discipline. The appropriate cadence varies by category value and market dynamics, but categories left uncontested for 3–5 years typically show measurable price drift relative to market rates.
Spend analytics and AI-powered category intelligence — Advanced analytics transform spend data from a backward-looking record into a forward-looking decision tool. AI-driven spend classification, off-contract spend identification, price variance analysis, and market benchmarking enable proactive optimization rather than retrospective review. For organizations without large internal analytics teams, an offshore delivery model staffed by domain-trained practitioners makes this a continuous capability — not a once-a-year exercise.
Total Cost of Ownership (TCO) analysis — Price-focused negotiations systematically undervalue total supplier performance. As CIPS defines it, TCO captures the full end-to-end cost of a supplier relationship — including quality failures, late delivery penalties, service interruptions, and switching costs — enabling more accurate comparisons and better-informed sourcing decisions. A supplier with a 10% lower unit price but a 15% higher defect rate is not a better deal.
KPIs to Track Your External Spend Optimization Progress
Spend Under Management (SUM) measures the percentage of total external spend flowing through approved procurement channels with active vendor management. It's the headline metric for any optimization program — a rising SUM indicates a greater share of external spend is being managed rather than left to ad hoc purchasing. APQC tracks this as a core procurement benchmark, and for most mid-market organizations, even modest improvements in SUM translate directly to realized savings.
Cost Savings vs. Cost Avoidance require separate tracking. Realized cost savings are reductions against a prior period or baseline; cost avoidance prevents future price increases through proactive renegotiation or sourcing. ISM and CAPS Research report an average procurement savings rate of around 3.1% and cost avoidance averaging around 2.0% of managed spend.
Organizations that measure only hard savings systematically understate procurement's financial contribution — and that gap matters when justifying headcount or investment to a CFO or PE sponsor.
Contract Compliance Rate — the percentage of spend flowing through pre-negotiated contracts at agreed pricing — surfaces where behavioral or process interventions are needed. A low compliance rate by category or business unit identifies exactly where maverick purchasing is concentrated. Tracking this metric creates accountability without requiring manual audit.
Supplier Performance Scorecard Metrics shift renewal decisions from relationship inertia to documented performance. A balanced scorecard covers:
- On-time delivery rate
- Defect or quality failure rate
- Invoice accuracy
- Lead time variability
- ESG compliance (now a formal requirement under many ESG disclosure frameworks)
Review scorecard results quarterly at minimum — a supplier scoring below threshold should trigger a corrective action plan before the next renewal cycle, not during it.
Frequently Asked Questions
What is external spend?
External spend refers to all payments an organization makes to third-party suppliers, vendors, partners, and service providers — covering raw materials, IT infrastructure, logistics, consulting, and marketing. It's distinct from internal labor costs and is typically the largest single controllable cost category in a business.
What is spend optimization?
Spend optimization is the discipline of analyzing and improving how an organization spends money — reducing costs, strengthening supplier performance, and ensuring spending aligns with strategic priorities. The goal is measurable value creation across the supplier base, not just short-term cost cuts.
What is the 70-20-10 budget strategy?
The 70-20-10 model, defined in HBR's 2012 article by Nagji and Tuff, allocates 70% of resources to core proven activities, 20% to adjacent improvements, and 10% to new experimental investments. In spend optimization, this framework helps balance operational efficiency with strategic innovation when allocating budget across supplier categories.
What percentage of total costs does external spend typically represent?
External spend represents 40–70% of total organizational costs for most enterprises. That makes it the largest single lever for improving financial performance — ahead of headcount reduction or capital expenditure adjustments in most scenarios.
What are the biggest barriers to external spend optimization?
Three barriers consistently block progress:
- Spend visibility gaps — data fragmented across multiple systems with no unified view
- Governance gaps — distributed purchasing decisions made without a coordinating framework
- Capacity gaps — limited procurement or analytics talent, particularly acute in mid-market companies without a dedicated center of excellence
How do PE-backed companies typically approach external spend optimization?
PE-backed companies treat third-party cost reduction as a core EBITDA lever, starting with a focused spend diagnostic in the first 100 days post-acquisition. BCG's analysis of PE cost resets found that centralized procurement diagnostics identified more than $100M in savings opportunities within that window alone. Structured procurement capability is then built to compound those savings through the hold period.