Introduction
Most procurement decisions get made with incomplete data. Teams negotiate contracts without knowing what they're already paying elsewhere, approve purchases that duplicate existing supplier agreements, and leave cost reduction opportunities sitting untouched in their ERP systems.
According to McKinsey, external spend represents 50%–80% of a company's cost base for most organizations. When that much money flows through third parties, operating without a structured view of where it goes isn't just inefficient — it's a strategic liability.
What separates procurement teams that capture real savings from those that don't usually comes down to one thing: how well they understand their spend. This guide walks through what spend analysis is, how to run it, and how to turn it into a continuous source of procurement value — not a one-time reporting exercise.
Key Takeaways
- Spend analysis answers three procurement fundamentals: what you're buying, from whom, and at what cost.
- The core output is actionable intelligence — not just reports — that drives cost reduction, supplier management, and strategic decisions.
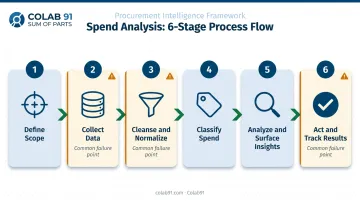
- The process follows six repeatable stages: data collection, cleansing, classification, analysis, insight generation, and action.
- Different analysis types (ABC, tail spend, category, supplier) each expose a distinct dimension of procurement performance.
- Without clean data and domain expertise, spend analysis produces reports — not decisions.
What Is Spend Analysis?
Spend analysis is the process of collecting, cleansing, classifying, and analyzing an organization's procurement expenditure data. The goal is straightforward: answer four questions with confidence.
- What are we buying?
- How much are we paying?
- Who are we buying from?
- Are we getting the best value?
CIPS describes spend analysis as the collection, classification, and analysis of historical spend data to improve spend visibility, compliance, and control. Done well, it becomes the data foundation that makes strategic sourcing, supplier management, contract compliance, and cost reduction possible — not a one-time exercise, but an ongoing discipline.
Spend Analysis vs. Spend Analytics
These terms are often used interchangeably, but they're not identical.
| Spend Analysis | Spend Analytics | |
|---|---|---|
| What it is | A structured review of historical and current spend data to produce specific findings | A broader, technology-enabled capability for continuous spend intelligence |
| How Gartner defines it | — | Platforms that cleanse, normalize, enrich, and visualize spend data to support ongoing strategic and operational decisions |
| The key distinction | Something you do | A capability you build |
Why Spend Analysis Is Critical for Procurement
Without spend visibility, procurement teams negotiate blind. They approve redundant purchases, miss consolidation opportunities, and can't tell whether suppliers are honoring contract terms. When external spend represents the majority of an organization's cost base, that blind spot has real financial consequences.
The performance gap between organizations with structured analytics programs and those without is substantial. Digital World Class procurement organizations deliver nearly double the spend cost-reduction savings of peers, spend 21% less on procurement overall, and achieve 2.5x higher ROI. Better tools help, but the real driver is having a reliable, continuous view of spend data.
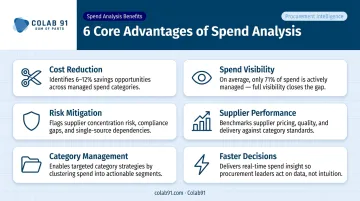
Core Benefits in Practice
Cost reduction: Spot maverick spend, consolidate suppliers, and negotiate from data rather than intuition. Bringing unmanaged spend under procurement control typically yields 6%–12% savings in the initial contract period.
Spend visibility: Procurement teams manage only about 71% of total enterprise spend on average — nearly a third of organizational spending operates entirely outside oversight. A structured program closes that gap.
Risk mitigation: Surface supplier concentration risks, contract non-compliance, and unusual spending patterns before they escalate into operational disruptions.
Supplier performance: Evaluate partners against delivery, quality, and contract metrics rather than tenure or familiarity. Data makes the case for which relationships are worth investing in.
Category management: Identify consolidation opportunities, benchmark pricing, and build category strategies grounded in actual transaction data — not assumptions.
Faster decisions: Replace gut-feel procurement choices with data-backed insights aligned to organizational goals.
These benefits compound at the portfolio level. For mid-market and PE-backed companies, spend analysis gives PE sponsors and operating partners the financial transparency to track savings realization, supplier exposure, and working capital optimization in real time — not at the end of a quarter when the window to act has already closed.
How Spend Analysis Works – Step by Step
The six stages below follow a logical sequence, but three failure points appear consistently across organizations: rushing data quality in Step 2, under-investing in classification in Step 3, and stopping at insight generation without connecting findings to action in Step 6.
Step 1 – Define the Scope and Objective
Before pulling a single data file, clarify what the analysis needs to answer. Are you looking for cost savings across all categories? Investigating a specific supplier? Building a baseline for the first time?
Define the time period, business units, and data sources in scope. Teams that skip this step produce outputs that are technically correct but practically irrelevant to the decision at hand.
Step 2 – Collect and Aggregate Spend Data
Pull data from all relevant sources:
- ERP systems
- Accounts payable
- Procurement platforms
- Expense management systems
- P-card transactions
Incomplete data at this stage creates blind spots that undermine every subsequent step. A spend analysis that only captures 60% of actual expenditure will produce recommendations based on a distorted picture.
Step 3 – Cleanse and Normalize the Data
This is the most time-intensive stage, and where most organizations underestimate the effort required. The same vendor may appear dozens of different ways across systems. Currency differences need reconciling. Duplicate entries need identifying and removing.
Skipping this step means downstream analysis inherits the chaos of the source data. Deloitte notes that accurate classification of procurement data depends on this foundation being solid first.
Step 4 – Classify Spend into Categories
Map every transaction to a structured spend taxonomy, organized into categories, subcategories, and line items. Consistent classification enables direct comparison across time periods, business units, and suppliers.
Manual classification at scale is slow and inconsistent. Automated classification tools, paired with human review, cut the time significantly while improving accuracy and coverage.
Step 5 – Analyze and Surface Insights
With clean, classified data, apply analytical frameworks (covered in the next section) to identify:
- Spending patterns and anomalies
- Consolidation opportunities
- Contract compliance gaps
- Pricing discrepancies across business units
The goal is to move from data to specific, prioritized findings — not a comprehensive report that nobody acts on.
Step 6 – Act and Track Results
Turn findings into action: renegotiate contracts, consolidate suppliers, challenge maverick spend, adjust payment terms. Then build a tracking mechanism to measure whether identified savings were actually captured.
The gap between "identified savings" and "realized savings" is where most programs leak value. Tracking is what closes it.
Types of Spend Analysis – What Each One Reveals
Spend data can be examined through multiple lenses. Each type of analysis answers a different procurement question and is most useful at different stages of the sourcing or supplier management cycle.
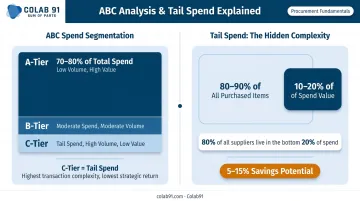
ABC Analysis (Pareto / 80-20 Focus)
ABC analysis categorizes spend into three tiers:
- A items — High-value, low-volume purchases that typically represent 70%–80% of total spend
- B items — Moderate value and volume
- C items — Low-value, high-volume tail spend
This framework helps procurement teams prioritize where to focus negotiation energy. A-tier suppliers warrant dedicated sourcing strategies and active relationship management. C-tier spend often gets managed through procurement automation or catalog buying rather than strategic sourcing.
Tail Spend Analysis
McKinsey defines tail spend as 80%–90% of all purchased items, representing only 10%–20% of total spend by value. CIPS further notes that the bottom 20% of spend typically accounts for 80% of all suppliers.
That ratio matters. Tail spend is where maverick buying concentrates, where non-preferred supplier usage is highest, and where procurement visibility is lowest. Tail-spend optimization typically offers 5%–15% savings potential — meaningful dollars despite the low per-transaction values.
Category Spend Analysis
Category analysis examines spending within a defined category hierarchy — identifying whether similar goods or services are being purchased from too many vendors at inconsistent prices.
This is the foundation for category strategy development. Without it, procurement teams can't build negotiation leverage, identify consolidation targets, or benchmark pricing against market rates.
Supplier Spend Analysis
Analyzing spend at the supplier level — year-over-year trends, spend concentration, payment terms, and contract compliance — helps procurement segment the supply base. Some suppliers are strategic partners worth investing in; others are transactional relationships worth consolidating or replacing.
The analysis creates the data foundation for renegotiation conversations grounded in actual numbers rather than impressions — so procurement knows exactly who it's talking to and what position it holds.
Spend Analysis KPIs and Tools
Key Metrics to Track
Tracking the right KPIs turns spend analysis into a continuous discipline, not a quarterly cleanup exercise:
| KPI | What It Measures |
|---|---|
| Spend under management (%) | Share of total spend actively managed by procurement |
| Cost savings: achieved vs. identified | Whether identified savings are actually being captured |
| Contract compliance rate | Share of spend purchased through contracted suppliers |
| Supplier consolidation ratio | Reduction in active suppliers over time |
| Maverick spend percentage | Share of purchases made outside approved channels |
| Payment terms compliance | Alignment between contracted and actual payment terms |
APQC benchmarks show that bottom-performing organizations have maverick purchasing equal to 2.5% or more of total purchases — a meaningful drag on procurement effectiveness.
Tool Categories and Trade-offs
| Tool Type | Strengths | Limitations |
|---|---|---|
| Spreadsheets (Excel) | Accessible, flexible, low cost | Breaks down at scale; heavy manual effort; error-prone |
| BI tools (Power BI, Tableau) | Strong visualization; flexible | Lack procurement-specific logic; require significant configuration |
| Purpose-built spend analytics platforms | AI-assisted classification; procurement-specific dashboards; faster insights | Higher cost; better suited to larger data volumes |
The right choice depends on data volume, team capacity, and organizational maturity. A 500-person company with fragmented ERP data will hit the ceiling on spreadsheets quickly. A large enterprise with existing SAP infrastructure might find SAP Ariba's spend analytics module (which consolidates spend visibility within the same ecosystem) the most practical path.
The tool is only as effective as the data quality and the team operating it. Organizations without dedicated in-house analytics talent need to staff and manage the process deliberately — not just purchase software.
How Colab91 Can Help
For mid-market and PE-backed companies, the challenge isn't understanding why spend analysis matters — it's building the capability to do it continuously without the overhead of a fully staffed in-house analytics team.
Colab91 is a specialized offshore capability center builder focused on procurement analytics and strategic sourcing.
The leadership team — including Madhur Kabra and Vijender Kapoor, formerly Country Head and Principal at Impendi (acquired by Accenture) — scaled that firm's India operations to 100+ practitioners serving Carlyle Group, TPG, Elliott, and BC Partners. That experience is what Colab91 now brings directly to mid-market and PE-backed clients.
What Colab91 Delivers
Rather than hiring expensive onshore analysts or investing in heavy software implementations without the people to run them, mid-market companies can use Colab91's offshore capability center model to build dedicated procurement analytics teams in India. These teams handle:
- Spend cube construction and ongoing maintenance
- Vendor consolidation and tail-spend analysis
- Off-contract spend identification and contract compliance tracking
- Supplier performance analytics and rationalization
- Price benchmarking and payment terms optimization
- Board-ready reporting and category-level deep dives

For companies without an established analytics baseline, Colab91's Savings Opportunity Assessment provides a structured starting point — a 4-6 week diagnostic that typically identifies 5%–15% of addressable spend in recoverable savings, delivered as a category-by-category roadmap with owners, targets, and timelines.
The Engagement Model
Colab91 operates through three primary models depending on a client's timeline and strategic objectives:
- Dedicated Team — An offshore analytics team embedded in the client's procurement function, with direct client ownership from day one
- Build-Operate-Transfer (BOT) — Colab91 builds and runs the capability, then transfers ownership to the client at 12–24 months — useful for PE-backed companies building permanent India-based functions
- Managed Operations — Colab91 maintains operational responsibility while the client retains strategic oversight; ideal for companies that want analytics capability without building offshore management expertise in-house
Regardless of model, analytics output is continuous — weekly and monthly intelligence packages, not annual reports — combining Colab91's AI-powered spend analytics platform with human analyst judgment on category strategy and supplier dynamics.
Conclusion
Spend analysis is not a project with a finish line. It's a continuous capability that, when functioning well, gives procurement teams the evidence they need to reduce costs, strengthen supplier relationships, and make decisions with confidence.
The gap between organizations that extract real value from spend analysis and those that produce periodic reports nobody acts on comes down to three things: data quality, the right analytical framework, and a team with the domain knowledge to turn findings into action. Tools accelerate that work — but only when the underlying data and analytical rigor are already in place.
If your organization is building or scaling that capability, Colab91 works with mid-market and PE-backed companies to stand up dedicated procurement analytics teams and AI-powered spend intelligence programs — the kind that produce decisions, not just dashboards.
Frequently Asked Questions
What is a spend analyst?
A spend analyst is a procurement professional responsible for collecting, cleansing, classifying, and analyzing an organization's expenditure data. Their core outputs include cost-saving opportunities, supplier performance insights, and category-level intelligence that supports strategic sourcing decisions.
What are spend analytics tools?
Spend analytics tools are software platforms that help organizations aggregate and analyze procurement data. They range from Excel and general BI tools to purpose-built procurement solutions that offer AI-assisted classification, real-time dashboards, and procurement-specific reporting — capabilities general tools don't provide out of the box.
What is SAP spend analytics?
SAP Ariba's spend analytics module is one of the leading enterprise-grade platforms for spend analysis, offering automated data integration, category classification, and reporting. It's typically used by large organizations already operating within the SAP ecosystem, where native integration with ERP data reduces implementation complexity.
What is the difference between spend analysis and spend management?
Spend analysis is the process of reviewing and understanding where money is spent — it's diagnostic in nature. Spend management is the broader discipline of controlling, optimizing, and governing all organizational spending. Analysis is one component of spend management, not a synonym for it.
How often should procurement teams run a spend analysis?
Leading procurement teams treat spend analysis as a continuous or at minimum quarterly practice. Decisions based on year-old data miss supplier performance shifts, pricing changes, and compliance gaps. Automated platforms and dedicated analysts make continuous monitoring practical — keeping procurement intelligence current and actionable.