Introduction
PE sponsors and operating partners face a frustrating reality at acquisition close: the portfolio company's spend data is a mess. Transaction records scattered across three ERPs, AP files that haven't been reconciled in months, and business units running on spreadsheets. The mandate to hit value creation targets within a 3–7 year hold period doesn't wait for clean data.
Spend analytics cuts through that fragmentation. It gives PE firms a structured way to identify third-party cost savings, rationalize supplier bases, and build a credible EBITDA improvement pipeline - often within weeks of data access.
According to Ardent Partners, the average enterprise has only 63.3% of total spend under active management - meaning more than a third of expenditure sits outside procurement's visibility entirely. In mid-market PE-backed companies, that figure is typically worse.
This article covers what PE spend analytics is, why it matters for value creation, how the process works, and how Colab91 helps sponsors execute it quickly after close.
Key Takeaways
- PE spend analytics aggregates, cleanses, and analyzes third-party expenditure to surface cost reduction and efficiency opportunities
- Most valuable at three stages: pre-close diligence, the 100-day plan, and ongoing hold period value creation
- The 80/20 rule applies: a small number of spend categories drives the majority of savings potential
- Common outputs: supplier consolidation targets, renegotiation candidates, maverick spend flags, and category benchmarks
- Most mid-market portfolio companies lack in-house analytics capacity, making offshore delivery models a practical path to execution
What Is Private Equity Spend Analytics?
PE spend analytics covers the full process of collecting, cleaning, classifying, and analyzing third-party expenditure data - across a single portfolio company or an entire sponsor's portfolio - to identify cost reduction and efficiency opportunities that drive EBITDA improvement.
CIPS defines spend analysis as collecting, classifying, and analyzing expenditure data to deliver visibility, compliance, and control. In a PE context, the same mechanics apply - but compressed timelines and exit-multiple math raise the stakes considerably.
What Makes PE Spend Analytics Different
Three factors distinguish PE spend analytics from standard corporate procurement work:
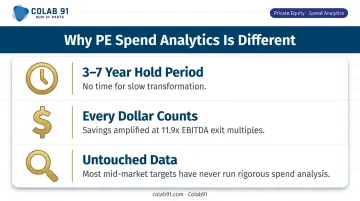
- A 3–7 year hold period leaves no room for an 18-month transformation program - savings need to materialize fast
- Every dollar of sustained cost reduction flows directly to enterprise value at exit multiples currently averaging 11.9x EBITDA in North America
- Many mid-market targets have never run a rigorous spend analysis - the acquisition is often the first time anyone asks "what are we spending, and with whom?"
Three Primary Use Cases
| Stage | Purpose | Key Output |
|---|---|---|
| Pre-close due diligence | Understand cost structure before acquisition | Baseline spend map, risk flags |
| 100-day plan | Prioritize quick wins post-acquisition | Prioritized savings pipeline |
| Ongoing value creation | Category management, supplier rationalization | Realized savings, dashboard reporting |
Why Spend Analytics Is Critical for PE Value Creation
Third-party spend - procurement of goods and services outside direct COGS - is one of the largest controllable cost categories in most portfolio companies. Bain & Company reports that external purchasing averages 43% of total costs across most firms. Even a modest reduction in that base produces meaningful EBITDA movement.
At current exit multiples, the math is straightforward: $1M in sustained annual savings translates to roughly $12M in incremental enterprise value at exit. Spend analytics exists to find and validate those dollars.
What Spend Analytics Actually Enables
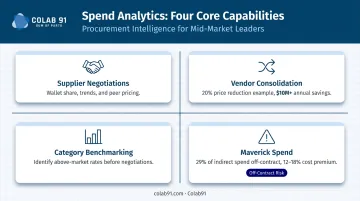
- Supplier negotiations backed by data. Procurement teams can show suppliers their total wallet share, year-over-year spend trend, and comparable pricing from peer companies - the kind of evidence that actually moves contract terms.
- Vendor consolidation after acquisitions. PE-backed companies that have grown through add-ons often carry five overlapping vendors for the same category across legacy entities. Bain documented one case where an agricultural chemicals company consolidated from 2,000 MRO suppliers down to one primary provider, achieving a 20% price reduction and over $10M in annual savings.
- Category benchmarking against market rates. Spend analytics enables comparison of a portfolio company's category-level pricing against market benchmarks or peer companies within the same sponsor's portfolio - identifying above-market rates before anyone sits down at the negotiating table.
- Maverick spend and compliance visibility. Research from The Hackett Group, cited by ISM, found that 29% of indirect spend is off-contract. Ardent Partners puts the cost of that non-compliance at an extra 12–18% on affected purchases. Spend analytics surfaces these gaps and creates a clear remediation path.
How PE Spend Analytics Works - Step by Step
Most PE-backed companies understand the value of spend analytics. The real challenge is execution: fragmented data, inconsistent ERP coding, and limited internal bandwidth consistently slow programs down. The steps below reflect how this actually gets delivered, not a textbook ideal.
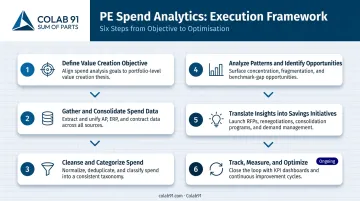
Step 1 - Define the Value Creation Objective
Spend analytics must start with a mandate tied to the investment thesis. Is the goal rapid EBITDA improvement within 12 months? Supplier consolidation after a merger? Category benchmarking ahead of a specific RFP event?
The objective determines which spend categories get prioritized first, what "good" looks like, and which stakeholders need to be aligned from day one. Starting without this clarity produces analysis that looks impressive and drives nothing.
Step 2 - Gather and Consolidate Spend Data
This is consistently the bottleneck. In PE-backed companies - especially those built through add-on acquisitions - spend data lives across multiple ERP systems (SAP, Oracle, QuickBooks), accounts payable records, P-card programs, and business unit spreadsheets.
McKinsey notes that midsize portfolio companies often struggle to determine a spend baseline because of fragmented and incomplete data across multiple unconnected sources. Teams routinely underestimate the time this step requires.
Offshore analytics teams that run data consolidation workstreams in parallel - across time zones - compress this phase significantly.
Step 3 - Cleanse and Categorize Spend
Raw AP data from most mid-market companies is poorly coded. Common issues:
- Duplicate vendor names ("IBM," "I.B.M.," "IBM Corp")
- Inconsistent line item descriptions across business units
- Spend coded to the wrong category or cost center
Cleansing involves deduplication, vendor name normalization, and applying a spend taxonomy - such as UNSPSC (the UN's open global classification standard) or a custom category tree - so that like spend can be compared across entities. Without this step, downstream analysis produces misleading results.
Step 4 - Analyze Spend Patterns and Identify Opportunities
With clean, categorized data, four analytical workstreams run in parallel:
- Who are the top suppliers, and is spend consolidated or fragmented across vendors?
- How do the company's rates compare to market references or portfolio peers?
- Where is spend bypassing contracted suppliers or purchasing policies?
- Which categories carry an excessive supplier count relative to spend volume?
Step 5 - Translate Insights into Savings Initiatives
Raw findings don't save money. This step converts analysis into a prioritized savings pipeline ranked by financial impact and ease of execution. Typical initiatives include:
- RFP/RFQ events for high-spend categories
- Contract renegotiations with incumbent suppliers
- Demand management (reducing volume or specification)
- Supplier consolidation across legacy entities
A well-built savings pipeline includes a visual heat map of opportunities - something operating partners and management can act on without digging through the underlying data.
Step 6 - Track, Measure, and Continuously Optimize
Identified savings and realized savings are not the same thing. This step closes the loop: tracking whether negotiated savings are landing in the P&L and validating realization against the original opportunity pipeline. Spend data should refresh on a quarterly cadence to capture new transactions and emerging opportunities. Without this discipline, savings programs tend to leak value between identification and exit.
PE Spend Analytics in Action: A Portfolio Company Walkthrough
The following is a simplified, representative scenario to illustrate the process.
A mid-market PE sponsor acquires a $200M revenue business services company assembled through five add-on acquisitions. The 100-day plan includes a third-party cost reduction workstream. Spend data sits across four ERP instances and a collection of entity-level spreadsheets.
After consolidation and cleansing, two categories surface as the highest-priority targets: IT services and facilities management. Both have significant overlap across legacy entities, with dozens of vendors performing similar scopes at different price points.
A common mistake at this stage is jumping directly to supplier conversations before the data is clean and aggregated. Without a consolidated view, the company has no leverage; suppliers know the buyer doesn't have a full picture.
The process that follows is sequential for a reason:
- Validate the spend map - confirm data is clean, aggregated, and normalized across all entities
- Run category benchmarking - identify where the company is paying above-market rates
- Launch a structured RFP - use benchmark data to run competitive negotiations with credibility
In this scenario, benchmarking reveals the company is paying above-market rates for a key indirect category. That data becomes the foundation for a three-vendor RFP the company couldn't have run six months prior.
The result: a prioritized savings pipeline of approximately $4–6M in annualized savings, split between quick wins executable within 90 days and longer-term strategic sourcing initiatives. At an 11–12x exit multiple, that pipeline represents $44–72M in potential enterprise value improvement - before any operational or revenue enhancements.
How Colab91 Can Help
Colab91 is a strategic delivery partner for PE sponsors and their portfolio companies building and executing spend analytics programs. The leadership team spent two decades doing this work through Impendi (a US-based boutique procurement analytics firm later acquired by Accenture), serving sponsors including Carlyle Group, TPG, Elliott, and BC Partners.
That experience now powers Colab91 - built specifically to make the same capability accessible to mid-market PE-backed companies.
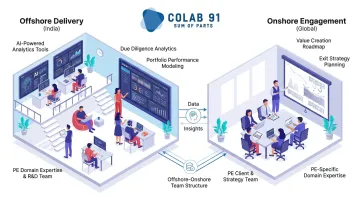
The "Sum of Parts" Model
Rather than replacing existing procurement or finance teams, Colab91 augments them. India-based analytics specialists handle the data-intensive workstreams (aggregation, cleansing, categorization, and reporting), while onshore teams focus on stakeholder management, supplier negotiations, and savings realization.
For mid-market portfolio companies without large internal analytics functions, the offshore team fills that gap directly - acting as a true extension of the client's procurement capability.
What Colab91 Brings to PE Engagements
- PE-specific domain expertise built through real programs at Carlyle, TPG, and Elliott - not generic analytics retrofitted to procurement
- Offshore delivery infrastructure in Gurugram, India, enabling parallel workstreams that compress 100-day plan timelines
- AI-powered spend analytics tools with unified data layers that support both point-in-time analysis and ongoing monitoring
- Flexible engagement models that adapt to different hold period stages - from a focused 100-day assessment to ongoing managed analytics through exit
- Proven scalability: the leadership team built Impendi's India operation from zero to 100+ practitioners, with clients including Pediatric Associates, Kindred Healthcare, Acosta, and Veolia
For PE sponsors managing multiple portfolio companies, Colab91 also supports platform-level analytics, consolidating spend visibility across the portfolio to identify cross-company sourcing opportunities that single-company programs miss.
Frequently Asked Questions
What is the 80/20 rule in private equity?
In PE spend analytics, the 80/20 principle means roughly 80% of a portfolio company's total spend is concentrated with around 20% of its suppliers. Strategic sourcing and renegotiation efforts focused on that top tier of suppliers deliver the fastest and highest returns - which is why spend concentration analysis is typically the first analytical step.
What is McKinsey Spendscape?
McKinsey Spendscape is a SaaS analytics platform developed by McKinsey & Company that helps organizations map, benchmark, and analyze procurement spend across categories and suppliers. It's often used during commercial due diligence or procurement transformation programs, and includes modules for synergy analytics relevant to M&A contexts.
What are the 4 P's of due diligence?
The 4 P's of due diligence typically refer to People, Process, Product/Portfolio, and Performance, the key dimensions a PE investor examines before closing an acquisition. Spend analytics directly supports the financial and operational diligence component, surfacing cost structure details that inform valuation and value creation planning.
How does spend analytics drive EBITDA improvement in PE portfolio companies?
Spend analytics identifies specific third-party cost reduction opportunities - including supplier consolidation, contract renegotiation, and eliminating maverick spend - that directly reduce operating expenses. Those savings flow straight to EBITDA, increasing the company's enterprise value at exit multiples.
What data is needed to run effective spend analytics for a PE-backed company?
The core inputs are accounts payable transaction data, purchase order records, supplier master files, and contract data - ideally extracted from ERP systems across all business units. Data quality and completeness is the single biggest determinant of how actionable the analysis will be.
How quickly can spend analytics deliver results after a PE acquisition?
Initial spend visibility and a prioritized opportunity pipeline can typically be delivered within 6–10 weeks of data access. Quick-win savings initiatives such as renegotiations and consolidations can often be initiated within the first 90–120 days, making spend analytics one of the fastest EBITDA levers in a 100-day plan.