The performance gap is measurable. Digital World Class procurement teams deliver 2.6x higher ROI, operate at 19% lower cost as a percentage of spend, and run sourcing cycles 24% faster than their peers. The difference isn't budget - it's how they use data.
This post covers the full picture: what procurement analytics is, the four maturity types, the core analytical methods practitioners use, the highest-impact use cases, and how organizations without large in-house teams can build this capability effectively.
Key Takeaways
- Procurement analytics means collecting and analyzing purchasing data - spend, suppliers, contracts, risk - to make smarter buying decisions
- The four types form a maturity ladder: descriptive → diagnostic → predictive → prescriptive
- Key methods: spend analysis, spend cube, Pareto analysis, and the Kraljic matrix for supplier segmentation
- Top use cases: cost savings, supplier risk, contract compliance, ESG tracking, and working capital improvement
- Mid-market and PE-backed companies can access this capability through offshore domain-expert teams - no large internal headcount required
What Is Procurement Analytics?
Procurement analytics is the practice of collecting, organizing, and analyzing data across the full procure-to-pay cycle - covering spend patterns, supplier performance, contract compliance, and supply risk - to generate insights that improve how an organization buys goods and services.
It goes beyond traditional reporting. Reporting tells you what happened; analytics explains why and guides what to do next.
One important distinction: spend analytics is a subset, focused specifically on categorizing and analyzing expenditure by supplier, category, and business unit. Procurement analytics is broader - it layers in supplier evaluation, risk assessment, contract lifecycle intelligence, and forecasting.
The Four Types of Procurement Analytics
Most organizations operate somewhere on a maturity ladder with four distinct stages:
| Type | Question Answered | Example |
|---|---|---|
| Descriptive | What happened? | Total spend by category last quarter |
| Diagnostic | Why did it happen? | Why did logistics costs spike in Q3? |
| Predictive | What will happen? | Which suppliers are at risk of price increases? |
| Prescriptive | What should we do? | Recommended actions to reduce spend by 10% |
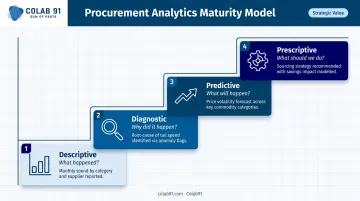
Most companies today operate primarily at the descriptive level - they can report spend, but struggle to diagnose causes or model scenarios. Moving toward prescriptive analytics is where organizations generate real strategic value - but it demands better data infrastructure and the right analytical talent.
McKinsey reports that **21% of CPOs have low data infrastructure maturity**, with less than 70% of spend data stored in one place. That data fragmentation is what keeps most organizations stuck at the bottom two rungs.
Why Procurement Analytics Matters
When procurement runs on instinct and spreadsheets, the losses accumulate quietly - in fragmented spend, missed negotiations, and compliance gaps that don't surface until the damage is done. Analytics changes that equation, giving procurement teams the visibility to act before problems compound.
McKinsey reports that data-driven sourcing can increase the pipeline of value-creation initiatives by up to 200%, citing Sanofi as achieving an average 10% reduction in spend through should-cost modeling and a 281% increase in savings through digitally enabled negotiations.
These gains aren't limited to large enterprises. For PE-backed companies, the opportunity is even more concentrated: McKinsey notes that leading PE firms can lift EBITDA by 20% within six months through digital and analytical procurement tools, with a total procurement target of 10–20% of EBITDA achievable after a short diagnostic.
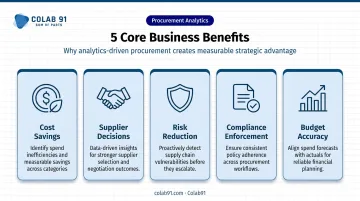
Core Business Benefits
- Cost savings - surfaces spend fragmentation, duplicate suppliers, and maverick buying before they erode negotiated rates
- Supplier decisions grounded in data - tracked performance on delivery, quality, and pricing replaces anecdotal feedback
- Risk reduction - surfaces supplier concentration risk, financial instability, or geopolitical exposure before disruptions hit
- Compliance enforcement - flags off-contract purchases and policy violations as they occur, not months later
- Budget accuracy - spend trend analysis gives finance teams a data-backed foundation for forecasting
Digital investment leaders don't just talk about these benefits - Deloitte's 2025 CPO survey found they met or exceeded cost-savings plans at 96% versus 80% for lower-maturity peers.
Key Methods in Procurement Analytics
No single method covers everything. Procurement professionals apply different analytical frameworks depending on the question being asked. These methods work regardless of whether you're running dedicated software, BI tools, or an analyst-led approach.
Spend Analysis
Spend analysis is the foundation of procurement analytics. CIPS defines it as the process of identifying, gathering, cleansing, grouping, categorizing, and analyzing spend data to decrease costs and improve efficiency.
At its core, it answers six questions: what was purchased, how much, at what price, by whom, from which supplier, and when.
Best practices for effective spend analysis:
- Automate data cleansing to normalize vendor names and remove duplicates before analysis
- Apply a consistent taxonomy (UNSPSC, the UN's open global product and service classification standard, provides a structured starting point)
- Segment spend by category, business unit, and supplier simultaneously for richer patterns
- Review high-spend categories regularly; run full cross-category analysis at least quarterly
The goal isn't just a clean spreadsheet. It's exposing maverick spend (purchases made outside approved contracts) and spend fragmentation where multiple teams buy the same thing from different suppliers at different prices.
Spend Cube & Category Profiling
The spend cube adds a third dimension to flat spend reports. Instead of just "what was bought," it maps three axes simultaneously: what (category), from whom (supplier), and by whom (business unit).
This multi-dimensional view catches patterns flat reports miss entirely. Two departments sourcing identical materials from separate suppliers at different prices is a classic spend cube finding: invisible in standard reporting, but obvious when mapped across all three dimensions.
Category profiling takes that a step further, analyzing a single category's market dynamics, supplier capabilities, and internal consumption patterns to build a tailored sourcing strategy. It's the analytical backbone behind category management and a prerequisite for any serious sourcing negotiation.
Pareto Analysis & Supplier Segmentation
Pareto analysis applies the 80/20 rule to procurement prioritization. As CIPS describes, procurement teams use it to break total spend down by value so analytical effort is directed where impact is highest rather than spread evenly across thousands of line items.
Once you know where spend is concentrated, the next question is how to engage those suppliers. The Kraljic matrix, originally published in Harvard Business Review, provides that structure. It classifies suppliers across two axes (spend impact and supply risk) into four quadrants:
| Quadrant | Spend Impact | Supply Risk | Strategy |
|---|---|---|---|
| Leverage | High | Low | Competitive bidding |
| Strategic | High | High | Deep partnerships |
| Bottleneck | Low | High | Secure supply |
| Non-critical | Low | Low | Automate and simplify |
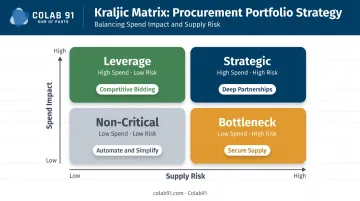
This segmentation directly determines where to invest analytical monitoring, relationship management, and contract negotiation resources.
Procurement Analytics in Action: Key Use Cases
Analytics delivers the most value when tied to specific business decisions, not just dashboard creation. Here's where it has the highest operational impact.
Category Management & Strategic Sourcing
Analytics gives category managers hard data to back sourcing decisions: spend trend profiles, supplier pricing benchmarks, and should-cost models that show what a product or service should cost based on underlying inputs.
The efficiency gains are real. McKinsey reports that Teva Pharmaceuticals reduced the time required to develop category strategies by 90% using smart spend category creation systems. Sourcing cycles that previously took months compress when analysts aren't rebuilding from raw data each time.
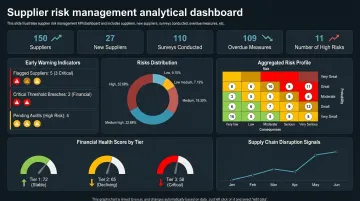
Supplier Performance & Risk Management
Manual supplier reviews rely on memory and relationship history. Analytics replaces that with objective tracking across every interaction:
- On-time delivery rates and trend lines
- Defect percentages and quality scores
- Invoice accuracy and contract adherence
- Early warning indicators of financial distress
Supply-chain disruptions lasting a month or longer occur on average every 3.7 years. McKinsey estimates a single prolonged production shock would wipe out 30–50% of one year's EBITDA for most industries. Predictive models that surface these signals early give procurement teams time to act before disruptions compound.
Contract Compliance & Maverick Spend Control
Analytics monitors contract adherence by comparing invoices, purchase orders, and agreed terms in real time - catching unauthorized price changes, missed volume discounts, and off-contract purchases before they accumulate.
The numbers make the case directly. According to Ardent Partners, every additional dollar of spend brought under procurement management typically yields 6–12% savings during the initial contract period. Digital World Class procurement teams also experience 60% less savings leakage from maverick buying and contract noncompliance compared to peers.
ESG & Sustainability Tracking
Scope 3 emissions - those in the supply chain - are on average 26x greater than a company's own operational emissions, according to CDP. Yet only 15% of companies disclosing to CDP have set a Scope 3 target.
Analytics brings structure to this gap by enabling:
- Measurement of supplier emissions and carbon footprints
- Tracking of ethical sourcing and labor standards
- Monitoring of supplier diversity spend
- Transparent ESG reporting for stakeholders
For PE-backed companies, PwC's survey of 150+ PE houses found that 95% integrate ESG into due diligence and 80% incorporate it into monitoring and reporting - which means supply-chain ESG data now factors directly into deal and portfolio decisions.
Working Capital & Financial Planning
Payment term analytics connects procurement directly to the finance function. Deloitte estimates that working capital improvement programs typically deliver 5–15% of net working capital improvement in under four months.
Spend forecasting adds another dimension - giving finance teams data-backed projections for budget planning rather than prior-year estimates with a percentage markup.
How Colab91 Can Help
Building a serious procurement analytics capability doesn't require hiring a full internal team. Colab91 was founded to address this gap for mid-market and PE-backed companies.
The leadership team brings over 16 years of hands-on experience in strategic sourcing, spend analytics, and offshore delivery - including building and scaling a 100+ person procurement analytics organization at Impendi (acquired by Accenture) that served PE clients including Carlyle Group, TPG, and Elliott.
What Colab91 delivers:
- Unified, durable data layers for spend analysis, savings opportunity assessment, and supplier risk management - powered by AI
- India-based domain expert teams that operate as dedicated extensions of a client's procurement and analytics function, not a generic outsourcing arrangement
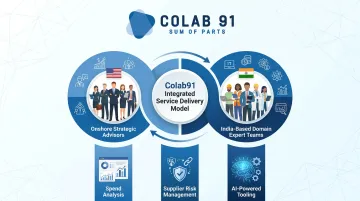
- The "Sum of Parts" model: strategic guidance from experienced onshore practitioners combined with efficient offshore delivery, built around procurement and analytics domain expertise
- Engagement structures that adapt to client size and complexity, with flexibility around entity ownership, IP rights, and strategic control
Unlike a BPO arrangement, Colab91 recruits procurement and analytics specialists - not generalists - and structures every engagement around measurable business outcomes from day one.
That domain depth extends to how engagements are designed. Advisor Erika Jung, a former CPO who led procurement transformation at Pediatric Associates (a TPG portfolio company), brings direct PE and healthcare procurement experience to client program design.
For PE sponsors and mid-market CPOs looking to close the analytics performance gap without the overhead of a full internal build, Colab91 provides domain-specialist teams, AI-powered tooling, and an engagement model structured for results from the start.
Frequently Asked Questions
What is procurement analytics?
Procurement analytics is the practice of collecting and analyzing purchasing data - spanning spend, suppliers, contracts, and risk - to generate actionable insights that improve how an organization buys goods and services. Unlike standard reporting, it explains why patterns occur and points toward what to do next.
What skills do you need to be a procurement analyst?
Core skills include data analysis and visualization (Excel, Power BI, SQL), knowledge of spend taxonomies and procurement processes, supplier evaluation methodologies, and the ability to translate data into business recommendations. Familiarity with ERP and P2P systems is also expected in most roles.
What is the difference between spend analytics and procurement analytics?
Spend analytics focuses specifically on categorizing and analyzing expenditure by supplier, category, and business unit. Procurement analytics is broader - it encompasses spend analysis plus supplier performance management, contract compliance monitoring, risk assessment, and spend forecasting.
What are the four types of procurement analytics?
The four types form a maturity progression: descriptive (what happened), diagnostic (why it happened), predictive (what will happen), and prescriptive (what to do next). Most organizations start with descriptive and build toward prescriptive as their data infrastructure and analytical capabilities develop.
How do mid-market companies get started with procurement analytics?
Start with a spend analysis to establish a baseline view of categories, suppliers, and business units. Focus analytical effort on one or two high-spend categories for early wins. Invest in data cleansing and taxonomy standardization before layering on advanced tools. If internal analytics capacity is limited, partnering with a domain-expert team accelerates the process.
What data sources are typically used in procurement analytics?
Internal sources include ERP systems, P2P or S2P platforms, financial systems, and supplier master data. External sources include commodity price indices, supplier financial health databases, market benchmarking reports, and ESG scoring providers.