Introduction
CPG enterprises run on margins that leave almost no room for error. Packaging, ingredients, contract manufacturing, logistics, and indirect procurement collectively consume a massive share of revenue-yet in most organizations, this spend sits fragmented across ERPs, buried in AP ledgers, and never properly analyzed.
The result is a set of compounding blind spots:
- Sourcing decisions made on partial data, not consolidated spend
- Supplier negotiations that lack volume visibility across business units
- No way to quantify input cost inflation exposure by supplier or SKU
- Off-contract purchasing that accumulates invisibly until it hits the P&L
According to McKinsey, procurement leaders maintain EBITDA margins at least 5 percentage points higher than laggards-a gap that traces directly to spend visibility and category discipline. For PE-backed CPG companies operating on compressed value-creation timelines, that gap is the difference between hitting and missing margin targets.
What follows is a practical breakdown of spend analytics in a CPG context-what it is, how a modern IT solution works end-to-end, and how mid-market companies are building this capability without the overhead of a large consulting engagement.
Key Takeaways
- Spend analytics transforms fragmented procurement and AP data into a structured "spend cube"-showing who buys what, from whom, at what price
- CPG companies without spend analytics routinely lose savings to maverick spend, duplicate suppliers, and overlooked volume consolidation
- A full IT solution spans data integration, taxonomy classification, visualization, and continuous category-level reporting
- For mid-market and PE-backed CPG companies, a hybrid onshore-offshore model delivers this faster and cheaper than traditional consulting
- The result: fewer suppliers, tighter margins, and procurement decisions grounded in clean data
What Is Spend Analytics in CPG?
Spend analytics is the systematic process of collecting, classifying, and analyzing an enterprise's purchasing data-across all categories, suppliers, and business units-to identify cost-saving opportunities, reduce risk, and improve margin efficiency.
In a CPG context, that means packaging materials, flavor ingredients, co-manufacturing fees, trade logistics, and indirect categories like MRO and facilities. The focus is on the cost side: where dollars flow outward to suppliers-not on consumer-facing revenue signals like demand forecasting or marketing ROI.
The Four Analytical Modes
Gartner identifies four core analytics types. An effective CPG spend analytics solution needs to support all four - each layer answers a different question and unlocks a different level of value:
| Mode | Question Answered | CPG Application |
|---|---|---|
| Descriptive | What was spent and where? | Category and supplier spend summaries |
| Diagnostic | Why did spend deviate from budget? | Off-contract purchasing, price variance by site |
| Predictive | What will category costs look like? | Input cost exposure modeling |
| Prescriptive | What sourcing action will protect margins? | Supplier consolidation, RFP triggers |
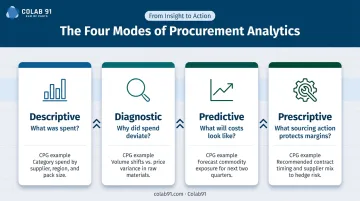
Most CPG organizations stop at descriptive. Moving into diagnostic, predictive, and prescriptive analytics is where actual margin improvement happens - through earlier intervention, tighter sourcing decisions, and fewer cost surprises.
Why CPG Enterprises Can't Afford to Skip Spend Analytics
Input Cost Exposure Is Real and Accelerating
The Consumer Brands Association reported that the Producer Price Index for food manufacturing rose 10.8% year over year, driven by ingredients, packaging materials, labor, and shipping. Without granular spend data, finance teams cannot quantify exposure by category or supplier quickly enough to respond-leaving gross margin undefended.
Maverick Spend Is an Invisible Tax
In large CPG organizations with multiple business units or geographies, off-contract purchasing accumulates without anyone tracking it. APQC defines maverick buying as purchases where an existing contract is ignored-and benchmarks organizations with maverick spend at 2.5% or more of total purchases as underperformers. At $500M in revenue, that threshold represents $12.5M or more in purchases bypassing negotiated pricing.
Supplier Fragmentation Destroys Negotiating Leverage
A structured spend analysis almost always surfaces the same pattern in CPG: the same raw material or service is being purchased from dozens of fragmented suppliers across business units, with no single unit holding enough volume to negotiate effectively. Consolidation-once the spend data makes it visible-unlocks pricing leverage that didn't exist before.
The PE Sponsor Case Is Straightforward
For private equity-backed CPG companies, third-party cost reduction flows directly to EBITDA without requiring revenue growth. Bain reports that top-performing procurement organizations reduce their purchasing cost base by 8% to 12%-and that CPG companies can boost gross margin by 200 to 300 basis points through more data-driven operational models. Spend analytics is the prerequisite for all of it.
The margin impact extends further once spend is classified and visible:
- APQC benchmarks show even top performers process 0.8% of disbursements in error-bottom performers reach 2%, making duplicate payment detection a fast win
- Preferred-supplier adherence becomes measurable and enforceable, closing the contract compliance gap
- Payment timing visibility across categories directly supports working capital and cash management decisions
How a Spend Analytics IT Solution Works
Most CPG organizations attempt spend analysis manually-ERP exports, pivot tables, spreadsheets passed around by email. This approach fails at scale for a predictable reason: the data is too dirty, too fragmented, and too stale to support decisions by the time it's assembled.
A dedicated spend analytics IT solution replaces that cycle with a structured, repeatable six-step process.
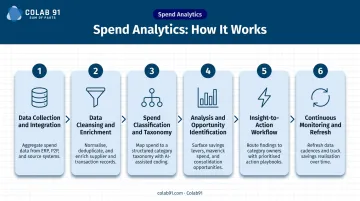
Step 1 – Data Collection and Integration
The solution consolidates purchasing data from every relevant source:
- ERP systems (SAP, Oracle, NetSuite)
- Accounts payable ledgers
- P-card and T&E transactions
- Supplier invoices and PO records
- Contract repositories
The challenge in CPG: companies with multiple brands or acquired businesses often run separate ERP instances. Data from each must be extracted, normalized, and merged before any analysis is meaningful.
Step 2 – Data Cleansing and Enrichment
Raw transactional data from CPG ERPs is reliably messy-inconsistent supplier names, missing GL codes, duplicate records, currency mismatches across geographies. Gartner estimates poor data quality costs organizations at least $12.9 million per year on average. In a spend analytics context, data quality at this stage determines whether every downstream savings projection is credible or contested.
Supplier master deduplication deserves particular attention. The same vendor frequently appears under multiple IDs across ERP instances, keeping consolidated spend with that supplier invisible until deduplication logic is applied.
Step 3 – Spend Classification and Taxonomy Building
Once cleansed, data is classified into a structured taxonomy-by supplier, category, business unit, and geography-to create the spend cube. UNSPSC (maintained by UNDP as an open global standard) provides a starting framework, but CPG requires an industry-specific layer:
- Packaging materials (flexible, rigid, labels)
- Flavor and ingredient categories
- Contract manufacturing and co-packing
- Trade logistics and 3PL services
- Marketing production services
- Indirect categories (MRO, facilities, IT)
CPG-specific classification surfaces category-level patterns that a generic taxonomy cannot-the difference between a report and a sourcing decision.
Step 4 – Analysis and Opportunity Identification
The spend cube enables category managers to identify:
- Consolidation candidates - suppliers overlapping in capability across business units
- Off-contract spend hotspots - categories where maverick purchasing is concentrated
- Price variance - the same item being purchased at different rates across sites
- Categories ripe for competitive bidding - high-spend, fragmented, no strategic supplier relationship
Key metrics tracked at this stage include cost savings potential, spend under management percentage, and contract compliance rate by category.
Step 5 – Insight-to-Action Workflow
Findings only create value when they drive action. This step converts analysis into structured sourcing moves:
- Develop category strategy by spend tier and strategic importance
- Prepare RFPs with supplier shortlists, volume data, and pricing benchmarks
- Use consolidated spend data as direct leverage in supplier negotiations
- Formalize new contract terms and set the compliance baseline for monitoring
For PE-backed CPG companies, this step is where the analytics investment pays out. The decision-to-action cycle needs to be short and governed-value creation timelines don't allow for six-month analysis cycles before any sourcing move is made.
Step 6 – Continuous Monitoring and Refresh
Spend analytics is not a one-time project. The IT solution must support regular data refreshes-monthly or quarterly-so that:
- Savings realization against targets is tracked post-contract
- New maverick spend is caught as it emerges, not six months later
- Supplier compliance is monitored against negotiated agreements
- Category leads have current data when market conditions shift
Organizations that run spend analytics continuously accumulate institutional knowledge about their supply base. Each successive sourcing event gets faster and more precise because the foundation is already built.
CPG Spend Analytics in Action: A Walkthrough
Consider a mid-market CPG company: $600M in revenue, two product lines (food and beverage plus personal care), three business units operating separate ERP instances, under PE ownership with a 150–200 basis point gross margin improvement target. (Per Bain, a 200–300 bps improvement is achievable for CPG companies through data-driven operational models, putting this target well within reach for disciplined operators.)
The Data Integration Challenge
The analytics team extracts AP and procurement data from three ERP instances. Immediately, supplier name inconsistencies emerge: the same flexible packaging supplier appears under six different vendor IDs across the three systems. Without deduplication, each business unit sees its own slice of spend.
Once deduplication logic is applied, the consolidated spend with that single supplier is nearly 3x any single-unit view. The leverage conversation changes entirely.
The Insight from Classification
Building the spend cube reveals that packaging spend is fragmented across 40+ suppliers, many overlapping in capability. No single business unit holds enough volume to negotiate competitive pricing on flexible packaging. The company is paying above-market rates not because it lacks buying power, but because that buying power is invisible to anyone until the data is unified.
The Action and Outcome
Armed with that consolidated view, the procurement team builds a cross-business-unit packaging consolidation strategy. An RFP goes to a shortlisted set of preferred suppliers with a unified volume position. Negotiated contracts deliver measurable unit cost savings that flow directly to gross margin. Post-contract, the spend analytics solution tracks actual purchases against negotiated pricing, confirming realized savings and flagging drift back toward off-contract suppliers.
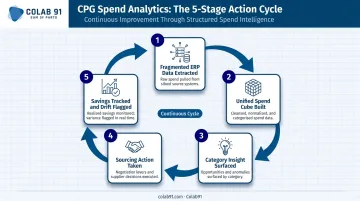
The full cycle, end to end:
- Fragmented data extracted from disparate ERP systems
- Unified spend cube built with deduplication and classification
- Category insight surfaced - hidden concentration and pricing gaps exposed
- Sourcing action taken - consolidated RFP, preferred suppliers, negotiated contracts
- Savings tracked against actual purchases, with off-contract drift flagged in real time
How Colab91 Can Help CPG Companies Build Spend Analytics Capability
Mid-market and PE-backed CPG companies face a specific problem: they need spend analytics capability urgently, but they don't have the in-house procurement analytics resources to build it-and they can't justify the cost of a large-firm consulting engagement.
Colab91 was built specifically to close this gap.
The Delivery Model
Colab91 establishes India-based capability centers staffed by domain-trained spend analytics practitioners who augment the client's existing onshore procurement or finance team. The offshore hub operates as an extension of the client's organization-not a vendor relationship-handling:
- Data integration setup and cleansing
- Spend classification and category mapping
- Ongoing analytics refresh and variance tracking
- Insight reporting aligned to procurement decision cycles
Relevant Domain Experience
Managing Partners Madhur Kabra and Vijender Kapoor both spent over a decade at Impendi (acquired by Accenture), building spend analytics functions for PE-owned enterprises. They've worked directly with Carlyle Group, TPG, Elliott, and BC Partners.
That background matters here. They understand mid-market ERP data realities, CPG category complexity, and the pace at which PE value creation timelines require decisions to move.
The Cost and Capability Equation
Colab91 delivers category-level spend dashboards, supplier consolidation analysis, and monthly savings tracking at a fraction of what an equivalent onshore consulting team would cost. The "Sum of Parts" philosophy means the offshore team augments-not replaces-the client's existing procurement or finance function. Institutional knowledge stays within the organization, and the capability builds with each engagement cycle.
For CPG companies operating on tight gross margins, that combination-domain depth, offshore efficiency, and a model designed to compound internal capability-is what separates a working spend analytics function from one that stalls after the first dashboard.
Conclusion
Spend analytics is not a reporting exercise for CPG enterprises-it is the operational foundation for every meaningful cost reduction, supplier consolidation, and margin improvement initiative. Without clean, classified, continuously refreshed spend data, category strategies are built on assumptions, supplier negotiations lack leverage, and savings projections are unverifiable.
As CPG input costs remain volatile and PE sponsors push for faster EBITDA improvement, companies that build spend analytics infrastructure now will make sourcing decisions with precision. Those still relying on manual ERP exports will keep making sourcing decisions in the dark-and the cost of that blind spot compounds with every procurement cycle that passes without structured data behind it.
Colab91 helps mid-market and PE-backed companies close that gap by building dedicated offshore procurement and analytics teams that run spend classification, supplier data management, and savings tracking as a continuous function-not a one-time project. If your spend data isn't driving decisions yet, that's the starting point.
Frequently Asked Questions
What is spend analytics?
Spend analytics is the process of collecting, cleansing, classifying, and analyzing an organization's purchasing data across suppliers and categories. The goal is to identify cost-saving opportunities, improve contract compliance, and support better procurement decisions-enabling procurement teams to prioritize negotiations based on actual spend exposure.
What is CPG in analytics?
CPG (Consumer Packaged Goods) in analytics refers to data analysis applied to companies that produce everyday consumer products. It spans demand forecasting, trade promotion optimization, supply chain efficiency, and procurement spend analysis-each targeting either revenue growth or cost reduction.
What are the 4 types of analytics?
The four types are descriptive (what happened), diagnostic (why it happened), predictive (what is likely to happen), and prescriptive (what action to take). CPG spend analytics uses all four, moving from reporting past spend to recommending specific sourcing actions.
What is the formula for spend analysis?
No single formula exists, but the structured approach follows four steps: aggregate and deduplicate purchase data, classify by supplier and category, then calculate spend concentration and off-contract percentages to size and prioritize sourcing opportunities.
How does spend analytics improve profit margins in CPG?
Spend analytics improves margins by surfacing supplier consolidation opportunities, identifying maverick spend driving above-contract pricing, and enabling volume-leveraged negotiations. Each reduces direct third-party cost, improving gross margin and EBITDA without a revenue increase required.
What data sources are needed for CPG spend analytics?
Core sources include:
- ERP and accounts payable transaction data
- P-card and T&E records
- Supplier invoices and contract repositories
- Procurement system outputs
CPG companies with multiple brands or ERP instances must consolidate all sources before meaningful analysis is possible.