The challenge is that "use analytics" sounds deceptively simple. Many SMEs attempt a spend review, get buried in messy data, produce a report nobody acts on, and conclude that analytics isn't worth the effort. Done poorly, it wastes time without changing anything. Done well, it surfaces opportunities that gut instinct and monthly P&L reviews consistently miss.
This guide walks through the five-step process for applying spend analytics, the specific inefficiencies it uncovers, what you need in place before you start, and the mistakes that derail most first attempts.
Key Takeaways
- Spend analytics moves SMEs beyond reactive expense tracking to systematic identification of leakage and misallocation.
- The core process runs from data consolidation and cleansing through category classification, pattern analysis, and assigning action owners.
- Common inefficiencies surfaced include maverick spend, supplier fragmentation, auto-renewing underused contracts, and unmanaged tail spend.
- Clean, consolidated data matters more than the tool. Spreadsheets are a valid starting point.
- Spending inefficiencies compound - every month without visibility has a cost.
The Five-Step Process for SME Spend Analytics
Spend analytics for SMEs is less about technology and more about discipline. The process - gather, clean, classify, analyze, act - can be run in phases, and even the first phase typically surfaces quick wins.
Step 1: Consolidate All Spend Data Into One Place
Pull every source of spend data into a single file or platform: bank feeds, credit card statements, invoices, purchase orders, and any ERP exports. Fragmented data is the root cause of most spend blind spots.
According to Ardent Partners' 2024 AP benchmark, 49.7% of invoices are still received manually, which means a substantial portion of SME spend data never flows automatically into any central system.
Each consolidated record needs at minimum:
- Vendor name
- Transaction amount and date
- Department or cost center
- Payment method
Without all four fields, meaningful categorization is impossible.
Step 2: Cleanse and Standardize the Data
Raw spend data is almost always messy. Vendor names appear in multiple formats ("Amazon," "Amazon.com," "Amazon Web Services"), currencies may be inconsistent, and cost center tags are often missing.
The same Ardent Partners report notes that 20.7% of invoices are flagged as exceptions due to missing information or approval issues - a reliable indicator of how much raw data requires attention before it's usable.
Key cleansing steps:
- Normalize vendor names to a single consistent format
- Remove one-off or non-recurring transactions that distort trend analysis
- Fill in missing department tags through invoice or GL lookups
- Convert all amounts to a single currency if you operate across markets
Clean data is the foundation - every step after this depends on it.
Step 3: Classify Spend Into a Category Taxonomy
Once data is clean, tag every line item to a spend category and subcategory. A basic two-level taxonomy works well for most SMEs:
| Category | Example Subcategories |
|---|---|
| IT & Software | SaaS subscriptions, hardware, support |
| Professional Services | Legal, consulting, accounting |
| Facilities | Rent, utilities, maintenance |
| Marketing | Agencies, media, events |
| Logistics | Freight, courier, warehousing |
This structured view makes it possible to compare spend across time periods and departments - something a flat, unorganized transaction list cannot do. Most SMEs stall at this step because building a taxonomy feels tedious. It isn't optional.
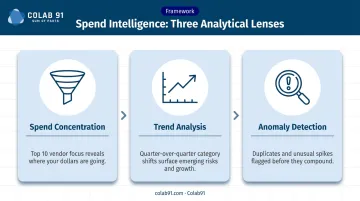
Step 4: Analyze Patterns, Concentrations, and Anomalies
With categorized data, apply three analytical lenses:
- Spend concentration - What percentage of total spend flows to your top 10 vendors? High concentration with strategic vendors can signal leverage; high concentration with non-contracted vendors signals risk.
- Trend analysis - How has spend in each category shifted quarter-over-quarter? Unexplained growth in a category often points to scope creep or missed renewal reviews.
- Anomaly detection - Are there duplicate payments, unusual spikes, or outlier transactions in otherwise consistent categories?
A simple pivot table or basic dashboard can surface patterns that months of routine bookkeeping missed. Step 5 is where those findings get turned into results.
Step 5: Prioritize Findings and Assign Action Owners
The final step converts findings into a prioritized list of opportunities, ranked by two factors: potential savings impact and ease of implementation. Each item needs a clear owner and a target completion date - without both, findings sit in a spreadsheet indefinitely.
Highest-value actions typically involve:
- Renegotiating contracts with top vendors
- Eliminating redundant subscriptions
- Consolidating fragmented supplier relationships
Address these before turning attention to smaller tail spend items.
Key Spending Inefficiencies That Analytics Can Uncover
Spend analytics surfaces inefficiencies that are invisible in day-to-day operations - problems that accumulate quietly and only become visible when someone examines the full picture of where money flows.
Maverick and Off-Contract Spending
Maverick spend refers to purchases made outside of approved vendors or negotiated contracts. It happens when employees default to convenience, are unaware of preferred supplier agreements, or simply bypass process. Analytics surfaces it by comparing actual vendor transactions against the approved vendor list.
A useful indicator: Ardent Partners reports that the average PO-based invoice rate is only 59.3%, meaning roughly four in ten invoices arrive without a corresponding purchase order. Non-PO invoices are a strong proxy for off-contract activity.
Supplier Fragmentation and Missed Volume Leverage
When an SME uses 12 different office supply vendors instead of consolidating to two or three, it loses negotiating leverage on every order, increases procurement overhead, and creates compliance risk. Analytics makes this visible by showing vendor counts per category and each vendor's share of category spend.
APQC's cross-industry benchmark finds that only 20% of active suppliers are classified as strategic across most organizations - meaning the remaining 80% represent fragmentation candidates worth reviewing.
A supplier rationalization exercise, informed by spend data, can reduce vendor count in a given category while unlocking better pricing through consolidated volume commitments.
Underutilized or Auto-Renewing Contracts
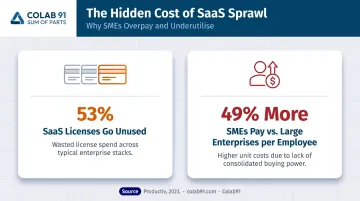
Contracted services - SaaS subscriptions, maintenance agreements, retainers - auto-renew at list price even when usage has declined. This is common in IT spend for growing SMEs, where tool proliferation outpaces actual adoption.
The numbers here are striking: Productiv's 2023 SaaS research found that 53% of SaaS licenses go unused, and that small businesses pay 49% more per employee for SaaS applications than large enterprises. Spend analytics cross-referenced with usage data identifies which contracts are being paid for but not being maximized - often the first category to yield measurable savings.
Unmanaged Tail Spend
Tail spend is the high volume of low-value, infrequent transactions that typically account for a small fraction of total spend but a disproportionately large share of procurement transactions and administrative time.
CIPS defines tail spend as commonly representing 10–20% of spend across 80% of suppliers.
The management burden is real: at an average invoice processing cost of $9.87 per invoice (Ardent Partners, 2024), processing thousands of micro-purchases through standard PO workflows adds up fast. Analytics helps SMEs decide whether to consolidate tail spend through a preferred marketplace or vendor card program, rather than continuing to route it through full procurement processes.
Price and Rate Inconsistencies Across Departments
In SMEs with decentralized procurement, different departments often pay different rates for the same service from the same supplier. Analytics reveals this by comparing unit prices across departments or time periods, giving procurement teams a concrete basis for rate standardization conversations with both internal stakeholders and suppliers.
These inconsistencies are rarely visible without cross-departmental spend data consolidated in one place.
What SMEs Need Before Starting
Spend analytics fails most SMEs before the analysis even begins. The most common culprit isn't a flawed methodology - it's starting without the right inputs in place.
Data Readiness
At minimum, you need 12 months of transaction-level spend data with consistent vendor names, amounts, dates, and cost center tags. Gaps in any of these fields will limit which analyses are possible and may require manual enrichment before proceeding.
Twelve months matters because it captures seasonality and contract renewal cycles that shorter windows miss.
Defined Scope and Objectives
Decide upfront which spend categories, time period, and business units are in scope. Set a specific objective - for example, "identify the top three cost reduction opportunities in indirect spend" - rather than a broad review that never produces a decision.
Analytical Capacity
Many SMEs lack a dedicated procurement analytics function. Options include:
- A finance team member working from structured templates
- Basic spend analytics software that automates categorization
- An offshore analytics partner purpose-built for mid-market companies
Colab91 works specifically with mid-market and PE-backed companies to establish dedicated offshore analytics teams - combining domain expertise in procurement and spend analytics with the cost efficiency of an India-based delivery model. For SMEs that can't justify a full-time internal hire, this type of model provides access to the capability without the fixed overhead.

Common Mistakes SMEs Make With Spend Analytics
The process is straightforward in theory. In practice, a handful of predictable execution errors derail most first attempts.
Analyzing spend in silos. Running analytics only within individual departments means supplier fragmentation and cross-department price inconsistencies stay hidden. Always consolidate at the total-company level first, then break it down by department.
Focusing only on large transactions. The instinct is to scrutinize big invoices and ignore small ones. But tail spend and subscription creep live in low-value, high-frequency transactions. Build the analysis to flag both absolute dollar size and recurrence patterns.
Treating it as a one-time project. A single spend review produces a point-in-time snapshot. For analytics to drive sustained improvement, SMEs need a review cadence - quarterly at minimum - and a clear owner accountable for tracking whether identified savings were actually realized.
Acting without benchmarks. Knowing that a company spends $200,000 annually on logistics isn't inherently actionable. Without a comparison point - prior year, per-unit rate, or industry peer data - there's no basis for judging whether the number is a problem. Organizations like APQC and CIPS publish procurement benchmarking resources across key spend categories. Use them to establish whether your numbers are competitive before drawing conclusions.
Conclusion
Spend analytics gives SMEs a systematic way to surface what gut instinct and routine bookkeeping consistently miss: maverick spend, supplier fragmentation, and auto-renewing contracts that quietly drain margin. These aren't exotic edge cases - they're present in most mid-market companies that haven't formally reviewed their spend data.
The path forward doesn't require enterprise technology or a large internal team. It requires clean data, a structured process, consistent review cycles, and - where internal bandwidth is limited - a partner who can build and run the analytics function alongside your team. The first review cycle rarely needs to be perfect. It needs to happen. Every quarter without visibility is a quarter of recoverable savings left on the table.
Frequently Asked Questions
What types of spending inefficiencies are most common in SMEs?
The most common issues are maverick spend (off-contract purchasing), supplier fragmentation, auto-renewing contracts with low utilization, and unmanaged tail spend. The specific mix varies by industry and how centralized procurement has historically been.
Do SMEs need specialized software to perform spend analytics?
Basic spend analytics can start with structured spreadsheets and consistent data fields. Dedicated tools accelerate the process significantly, but clean, consolidated data matters more than the platform you use. Start with the data, then evaluate whether dedicated tooling is worth the investment.
How is spend analytics different from expense management?
Expense management tracks and reports individual transactions for compliance and reimbursement purposes. Spend analytics looks at aggregate patterns across categories, vendors, and time periods to identify strategic savings opportunities. If expense management tells you what was spent, spend analytics tells you whether it should have been spent that way at all.
How much data does an SME need before starting a spend analysis?
A minimum of 12 months of transaction-level data is recommended to capture seasonality and contract renewal cycles. Less data is still usable but limits how much you can rely on trend-based conclusions.
How long does it take to see results from spend analytics?
Initial findings - supplier fragmentation, maverick spend instances, duplicate payments - typically emerge within the first analysis cycle. Realized savings from renegotiated contracts or rationalized suppliers generally materialize within one to two quarters of renegotiating contracts or consolidating suppliers.
Can SMEs run spend analytics without a dedicated procurement or analytics team?
Structured templates and part-time finance team involvement can carry initial reviews without dedicated headcount. For ongoing programs, offshore analytics partners can bridge the capability gap without the cost of a full-time in-house hire.