
Introduction
U.S. national health expenditures reached $5.3 trillion in 2024, equal to 18% of GDP and growing at 7.2% year-over-year, according to CMS data. That's nearly twice the average OECD country's health spending as a share of GDP. CMS projects this will climb to 20.3% of GDP by 2033.
For healthcare organizations, those macro numbers translate directly into margin pressure. Hospital labor costs alone hit $839 billion in 2023, nearly 60% of total hospital expenses. Medical supplies added another $146.9 billion. Administrative overhead consumes an estimated 15–25% of national health expenditures.
For mid-market and PE-backed providers operating on thin margins, these compounding pressures land directly in monthly P&Ls.
The good news: healthcare spending is not inherently uncontrollable. It becomes expensive primarily because of fragmented data, reactive procurement, and the absence of systematic oversight. This guide addresses how organizations can take deliberate control across three dimensions:
- Decisions: sourcing, contracting, and care protocol choices made upstream
- Management practices: visibility, accountability, and consistency in active spend
- Structural context: the organizational capabilities and care models that determine baseline cost
Key Takeaways
- Healthcare costs compound across labor, supplies, admin, and clinical variation — quietly, until a margin review exposes the gap
- Most overspending traces back to poor upstream decisions, not unavoidable cost increases
- Real-time spend visibility is a prerequisite for any meaningful cost reduction program
- The highest-ROI strategies target vendor contracts, care protocols, and benefit design — before spend is committed
- Dedicated procurement and analytics capability builds a cost advantage that holds across budget cycles
How Healthcare Costs Typically Build Up
Healthcare spending doesn't appear as a single line item. It accumulates across clinical labor, medical supplies, pharmaceuticals, administrative overhead, third-party services, and employee health benefits — often without any consolidated view across categories.
The build-up is gradual and compounding. Small inefficiencies in vendor contracts or billing practices multiply across thousands of patient encounters, departments, and facilities before surfacing as a visible financial problem.
A 2% pricing gap on a pharmacy contract looks negligible in isolation. Across a health system's entire formulary spend, it can represent millions in annual leakage.
The Hidden Cost Problem
Many healthcare costs stay invisible until an audit or M&A integration forces a reckoning. Common examples include:
- Duplicate vendor contracts from post-merger entities, each billing independently with no consolidated oversight
- Off-contract purchasing where departments buy at spot prices outside negotiated agreements
- Pharmacy pricing that hasn't been benchmarked against market rates in years
- Shadow IT and service agreements persisting long after the original business need has gone
Without a unified spend data layer, organizations are managing costs blind. Underperforming contracts go unchallenged, clinical variation quietly drains resources, and administrative overhead accumulates with no clear owner.
Key Cost Drivers in Healthcare Spending
You can't control what you haven't diagnosed. Four cost drivers account for the majority of healthcare spending growth — and each one compounds the others.
Price Inflation Above General CPI
Medical care prices have risen 121.3% since 2000, compared to 86.1% for all consumer goods, according to Peterson-KFF data. In mid-2024, medical inflation ran at 3.3% versus 3.0% overall CPI — a modest gap that compounds significantly at $5.3 trillion in base spending.
Labor inflation compounds this further. Kaufman Hall reported labor expenses per calendar day were up 5% through September 2025 versus the same period in 2024. Supply chain costs are projected to increase another 2.3% through mid-2026 per Vizient.
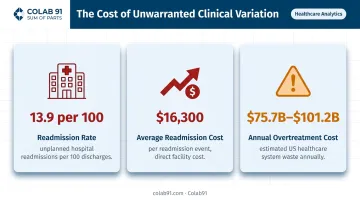
Clinical Variation Without Evidence-Based Justification
When care protocols differ across physicians, departments, or facilities without clinical rationale, costs rise without any corresponding improvement in outcomes. The Dartmouth Atlas found that on an illness- and price-adjusted basis, some communities spend twice as much on healthcare as others with no measurable benefit.
The downstream effects are concrete:
- Higher readmission rates (U.S. 30-day all-cause rate: 13.9 per 100 admissions in 2020)
- Average readmission cost of $16,300 — 12.4% above the average index admission
- JAMA estimates overtreatment and low-value care costs $75.7B to $101.2B annually
Administrative Complexity from a Multi-Payer System
The U.S. multi-payer environment generates overhead that single-payer systems avoid. According to data published in the Annals of Internal Medicine, U.S. insurers and providers spent $812 billion on administration in 2017 — $2,497 per capita versus just $551 in Canada. That gap represents administrative overhead consuming 15–25% of national health expenditures.
HFMA reported in 2024 that 90% of health system CFOs identified payer denials as their top revenue cycle challenge. Payer denials are a structural inefficiency built into the multi-payer relationship itself, not a clinical one — and fixing them requires operational redesign, not clinical intervention.
Upstream Contract and Formulary Decisions
Decisions made early — GPO affiliations, staffing agency contract terms, pharmaceutical formulary design — lock in cost structures that persist for years. A poorly negotiated staffing contract signed during a tight labor market doesn't expire when conditions improve. One hospital system analysis found that renegotiating a single travel nurse agency contract after the COVID surge — when leverage had shifted back to the buyer — recovered $4–7M annually that had been locked in at peak-crisis rates. The moment of contract execution is where lasting cost exposure is set; most organizations spend more time managing invoices than interrogating the contracts behind them.
Cost-Reduction Strategies for Healthcare Spending
The right strategy depends on where costs originate. The three categories below map to distinct intervention types.
Strategies That Reduce Costs by Changing Decisions
These strategies reduce costs by making better choices before spending is committed.
Consolidate and renegotiate vendor and supplier contracts. Audit all third-party spend categories, identify redundant or underperforming vendors — particularly post-acquisition — and use consolidated volume to renegotiate pricing on medical supplies, devices, and pharmacy. Benchmarking against market rates is non-negotiable: without it, there's no objective basis for identifying where contracts are above fair value.
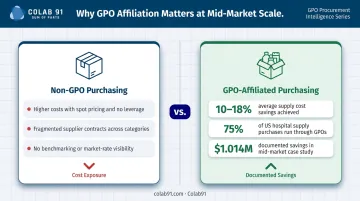
GPO affiliation is often underused at mid-market scale. GPO purchases represent roughly 75% of total hospital supply purchases per MedPAC, with affiliated providers saving an estimated 10–18% over unaffiliated purchasing. Vizient case data shows a university-based health system generated $1.014M in value over six months by converting $11.4M in non-contract spend to GPO-contracted vendors.
Shift toward value-based agreements. Purely fee-for-service or unit-price contracts create incentives to over-order and over-deliver. Vendor and payer arrangements that tie compensation to outcomes and utilization targets align financial incentives with efficient care — reducing unnecessary consumption without restricting clinically appropriate care.
Implement evidence-based clinical protocols. Standardizing care delivery reduces unnecessary variation in procedures, diagnostics, and prescribing patterns. This requires physician engagement and unbiased performance data — neither of which can be mandated top-down. Organizations that have succeeded here have treated protocol standardization as a physician-led initiative supported by data, not an administrative imposition.
Right-size employee health benefit design. For organizations managing employee benefits, adjust deductibles, cost-sharing tiers, formularies, and network configurations to align financial incentives with efficient care-seeking. The goal is to remain competitive for talent while reducing unnecessary utilization — two objectives that are compatible with thoughtful benefit design.
Strategies That Reduce Costs by Changing How Spending Is Managed
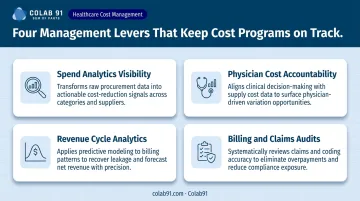
Well-designed contracts and protocols only deliver their intended value if management practices keep them on track. Four levers matter most here:
- Spend analytics visibility — a unified data layer that identifies where spending exceeds benchmarks, where contracts underperform, and where clinical variation drives resource consumption
- Physician cost accountability — data-driven performance visibility that creates informed advocacy for efficient practices rather than top-down compliance pressure
- Revenue cycle analytics — predictive propensity-to-pay models that enable earlier financial counseling and reduce bad debt write-offs as patient responsibility rises
- Billing and claims audits — periodic reviews that surface overbilling, undercoding, and duplicate claims before they accumulate into significant compliance exposure
On spend analytics specifically: platforms that combine AI-powered data cleansing and classification with dedicated analyst teams shift procurement from reactive to continuous. Colab91's Spend Analytics platform handles this across healthcare-specific categories — medical/surgical supplies, pharmaceuticals, GPO contracts, purchased services, and EHR systems — then surfaces savings opportunities through vendor consolidation analysis, off-contract spend identification, and price benchmarking.
On physician engagement: the distinction between performance management and clinical improvement is not semantic. Physicians disengage when data feels punitive. Unbiased visibility into complication rates, length of stay, and resource consumption per episode creates advocates — not resistors.
On claims audits: HFMA finds that 90% of CFOs name payer denials their top revenue cycle challenge. Regular billing and coding reviews surface recoverable leakage before it compounds into compliance exposure.
Strategies That Reduce Costs by Changing the Structural Context
The most durable cost reductions come from changing the conditions that generate high costs — not just managing existing spend more carefully.
Invest in preventive care and chronic disease management. The top 5% of healthcare spenders accounted for 49.7% of all expenditures in 2022, per AHRQ MEPS data. CDC reports that 90% of U.S. healthcare expenditures flow to people with chronic and mental health conditions. Proactive management of high-cost chronic populations reduces the frequency and intensity of expensive acute episodes.
A note of caution: CBO found that roughly 20% of preventive services both improve health and reduce costs — meaning most preventive investments produce clinical benefit without immediate cost savings. The ROI case is strongest for targeted chronic disease management in clearly identified high-utilizer populations, not blanket preventive care investments.
Use telehealth and virtual care to reduce per-encounter costs. Virtual care reduces facility overhead, increases provider throughput, and lowers access barriers. Physician adoption has grown substantially — 71.4% of physicians reported using telehealth weekly in 2024, up from 25.1% in 2018. Reimbursement alignment matters: research from Health Affairs/RAND found that direct-to-consumer telehealth for acute respiratory illness increased net spending by $45 per user, largely because it generated new utilization rather than replacing in-person visits. The cost benefit is real, but it depends on appropriate use cases and payment model design.
Build dedicated procurement and analytics capability. Many mid-market and PE-backed healthcare organizations rely on generalist staff for sourcing and financial analysis — no spend cube, no contract benchmarking, no category expertise. This limits their ability to identify leakage, negotiate effectively, or execute complex sourcing events.
Building a specialized function — or augmenting in-house teams with domain-expert offshore talent — creates a structural advantage that compounds over time. Colab91 works with healthcare organizations like Pediatric Associates (a TPG portfolio company) to build India-based capability centers staffed with procurement and analytics practitioners.
These teams cover healthcare-specific categories — medical/surgical supplies, pharmaceuticals, GPO optimization, purchased services, and contingent clinical labor — and operate through flexible models: dedicated team, build-operate-transfer, or managed operations, scaled to the organization's size and PE timeline. The outcome is enterprise-grade analytical depth at a mid-market cost structure.
Access GPO and shared service pricing for collective purchasing power. Smaller organizations that cannot negotiate enterprise pricing independently can access it through GPO affiliation or shared service arrangements. This shifts the cost position without requiring proportional internal investment — particularly relevant for independent physician groups and mid-size health systems operating outside major IDN structures.
Conclusion
Sustainable healthcare spending optimization requires precision about where costs actually originate — in decisions made too quickly, in management practices that allow drift, or in structural conditions that make inefficiency systemic. Blunt budget cuts address none of these root causes.
The organizations achieving lasting margin improvement share a common approach: they treat cost management as a continuous organizational capability, not a periodic initiative. That requires building the analytical infrastructure, procurement discipline, and cross-functional accountability to sustain it over time.
The operational foundations that make this work:
- Real-time spend visibility across categories and facilities
- Upstream contract discipline before commitments are locked
- Clinical protocol standardization where evidence supports it
- Dedicated talent to execute and sustain the program
For mid-market and PE-backed providers, building that capability at enterprise depth — without enterprise cost — is where the real structural advantage lies.
Frequently Asked Questions
How to reduce healthcare spending?
Effective reduction combines upstream improvements (vendor renegotiation, evidence-based protocols, benefit redesign) with real-time spend visibility and dedicated procurement capability. Targeting the right cost driver matters more than across-the-board cuts — the same dollar of effort yields very different returns depending on where it's applied.
What are the 4 C's of healthcare finance?
The 4 C's — Costs, Cash, Capital, and Control — summarize core finance activities at healthcare organizations, as described by ACHE/Reiter and Song. Each dimension shapes spending decisions: costs set the baseline, cash governs operational flexibility, capital determines investment capacity, and control provides the governance to keep all three aligned.
What is healthcare spending optimization?
It's a systematic process of identifying, analyzing, and reducing unnecessary or avoidable healthcare expenditures across clinical, operational, and administrative categories — without compromising care quality or workforce competitiveness. Ad hoc cost-cutting rarely holds; structured programs with ongoing measurement do.
What are the biggest drivers of rising healthcare costs?
The primary drivers are healthcare price inflation exceeding general CPI, an aging population with rising chronic disease burden, administrative complexity from the multi-payer system, and unwarranted clinical variation in care delivery. Together, these account for the majority of the gap between U.S. health spending and peer-nation averages.
How does procurement analytics help reduce healthcare costs?
Procurement analytics gives organizations visibility into category-level spend, benchmarks contracts against market rates, identifies vendor consolidation opportunities, and surfaces off-contract purchasing. This enables smarter sourcing decisions at the point of negotiation and provides the ongoing performance data needed to hold contracts accountable over time.
What is value-based care and how does it reduce costs?
Value-based care ties provider compensation to patient outcomes and quality metrics rather than service volume, aligning financial incentives with efficient, effective care. CMS administers several such programs for Medicare providers, with the Shared Savings Program among the most widely adopted.