Introduction
Most procurement teams have more data than they know what to do with. Purchase orders, invoices, supplier records, contract terms - it's all there. The problem isn't visibility. It's interpretation.
According to KPMG's 2024 Future of Procurement report, only 41% of procurement professionals rate their organization's category management as "highly mature." That means the majority are flying partially blind - renewing contracts on auto-pilot, missing consolidation opportunities, and making sourcing decisions based on intuition rather than category-level evidence.
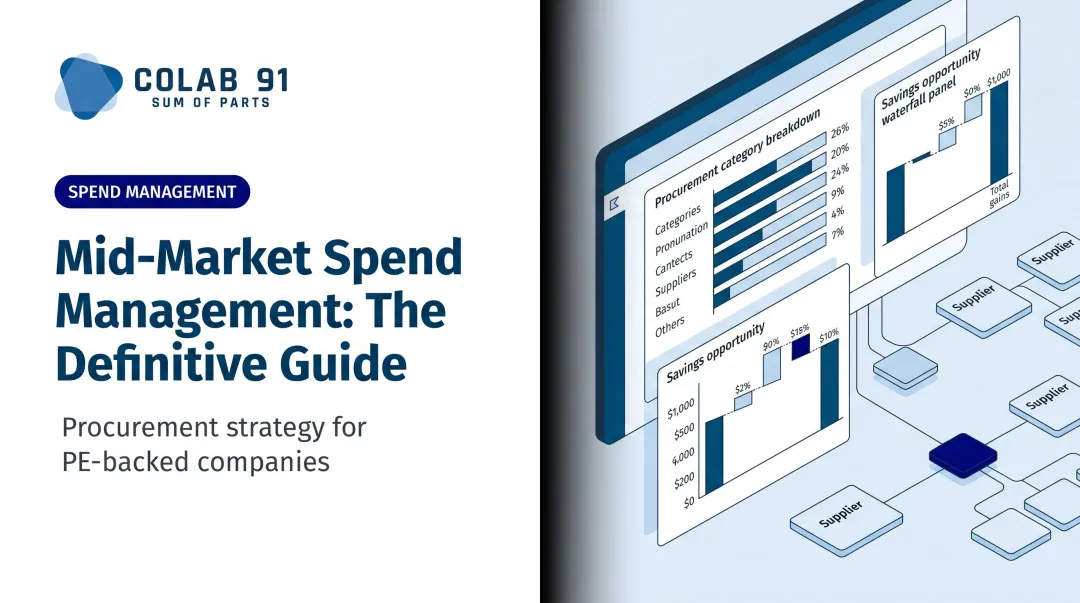
For mid-market and PE-backed companies, the stakes are concrete. Tighter margins, compressed value-creation timelines, and indirect spend complexity that grows faster than procurement headcount: these pressures demand more than a spend dashboard. They require category management analytics: the discipline that converts raw spend data into decisions you can actually act on.
This article explains what that process looks like, where most organizations get stuck, and how to build the capability without standing up a costly in-house analytics function.
Key Takeaways
- Category management analytics groups procurement spend by category to surface savings opportunities, supplier risks, and sourcing actions - not raw totals.
- It sits above both spend analytics (what was spent) and strategic sourcing (which supplier to use), connecting the two.
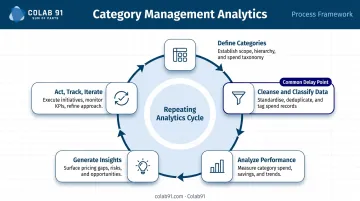
- The process follows five stages: define categories, cleanse data, analyze performance, generate insights, act and iterate.
- Most projects stall at data cleansing - budget more time here than you think you need.
- Mid-market and PE-backed companies can accelerate capability by pairing offshore domain expertise with onshore strategic control - without building a full internal function.
What Is Category Management Analytics?
Category management analytics is the systematic process of grouping procurement spend into logical categories and analyzing that data to optimize buying decisions, supplier relationships, and cost performance over time.
That definition matters because the term gets confused with two related but distinct practices:
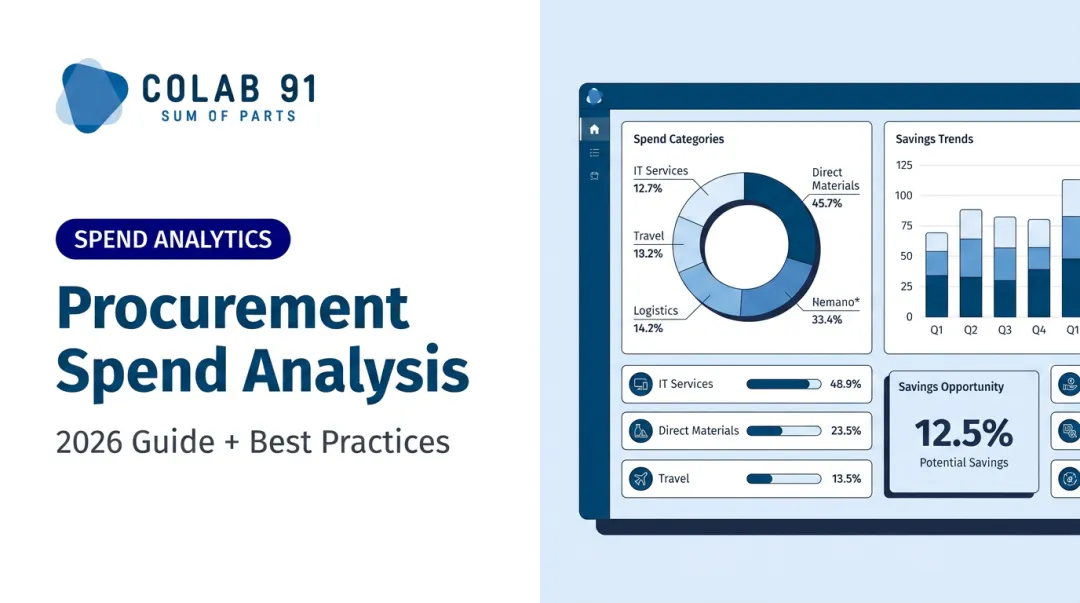
- Spend analytics tells you what was spent and where - it's descriptive visibility.
- Strategic sourcing analysis focuses on evaluating and selecting suppliers for a defined need.
- Category management analytics sits above both - it interprets patterns across an entire category over months or years, informing how you approach the market, not just who you buy from next quarter.
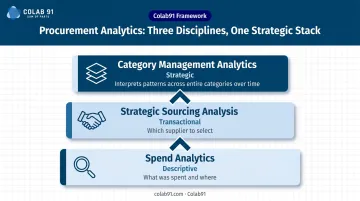
As CIPS notes, category management examines total category spend, markets, and suppliers as an integrated view, whereas strategic sourcing stays transactionally focused on supplier selection.
That integrated scope extends across both direct spend (raw materials, components) and indirect spend (IT, facilities, marketing, professional services). Analytical techniques range from descriptive - what happened in a category last year - to predictive, forecasting where prices or demand are heading. The goal throughout is the same: smarter decisions at the category level, not just cheaper transactions.
Why Category Management Analytics Matters for Mid-Market and PE-Backed Companies
External spend typically accounts for 50% to 80% of a company's total cost base, according to McKinsey. For most organizations, that makes external spend the single largest cost lever available. Yet without category-level analytics, procurement teams manage that spend reactively: chasing invoices, renewing contracts late, and treating each category as an isolated problem rather than a portfolio.
The Mid-Market Gap
Mid-market companies face a specific version of this problem. They've typically outgrown informal procurement but haven't yet built the analytics infrastructure to manage spend strategically. The result: fragmented supplier bases, price inconsistency across sites, and EBITDA impact from savings that were never captured.
McKinsey's research on PE procurement found that traditional RFP methods often capture less than half of available procurement value - the rest sits in pricing discrepancies, excessive spend fragmentation, and commodity index disconnects that only surface through analytics.
The PE Pressure Test
For PE-backed companies, category analytics is tied directly to value creation narratives. Procurement savings factor prominently into 100-day plans, and structured category analytics can lift run-rate EBITDA by up to 20% within six months for midsize portfolio companies. That's not achievable without a category-level view of where spend is concentrated, where contracts are missing, and which suppliers are underperforming.
Sponsors and portfolio CPOs need a structured data trail - one that links procurement decisions directly to financial outcomes. Category management analytics makes that connection visible, turning spend data into the evidence base that supports every value creation conversation.
- Spend concentration: Identifies where volume leverage is being left on the table
- Contract coverage gaps: Flags categories operating without negotiated terms
- Supplier performance: Connects delivery and quality data to cost outcomes
How Category Management Analytics Works: From Spend to Insight
The analytics process isn't a one-time report. It's a repeating cycle, and most organizations fail at one of two points: data preparation or the translation of analysis into action. Here's how the five stages work.
Step 1 – Define Category Boundaries and Objectives
Before any data is touched, someone has to define what a "category" actually means for this organization. The definition is rarely as settled as it seems.
Without a consistent spend taxonomy, analysis becomes incomparable across business units or time periods. A category labeled "IT" in one division might include software, hardware, and managed services - while the same label in another division covers only laptops. Resolving these inconsistencies before analysis begins prevents weeks of reclassification work later.
Step 2 – Cleanse, Classify, and Enrich Spend Data
This is where most projects slow down. Raw transactional data from ERP and P2P systems is typically incomplete, inconsistently coded, and spread across multiple sources. Step 2 involves:
- Normalizing supplier names (the same vendor may appear dozens of ways)
- Mapping transactions to the agreed taxonomy
- Enriching records with contract coverage, payment terms, and market benchmarks
The most common mistake here is underestimating the time required. Data cleansing often accounts for the majority of analytics project delays - and teams that skip it produce analysis that can't be trusted.
Step 3 – Analyze Category Performance
With clean data, the analysis can begin. Key measures at the category level include:
- Spend concentration - how many suppliers hold what share of category spend
- Price variance - cost differences for identical items across sites or business units
- Maverick spend percentage - transactions outside contracted channels
- Contract compliance rate - spend covered by active agreements
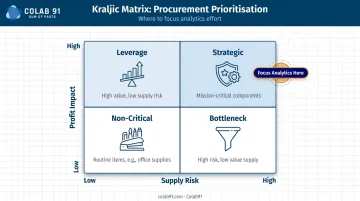
The Kraljic Matrix is a practical tool at this stage, classifying categories by supply risk and profit impact. It prevents teams from giving equal analytical attention to office supplies and mission-critical components - focusing effort where it matters.
Step 4 – Generate Strategic Insights
There's a meaningful difference between an observation and an insight. Reporting that "IT spend increased 15%" is an observation. An insight explains why it increased, identifies which suppliers drove it, benchmarks it against market rates, and recommends the sourcing lever to apply next.
Getting to that level requires more than internal data. Supplier performance records, external market benchmarks, and cross-category interdependencies all contribute. A category manager who sees that software spend spiked due to three unmanaged SaaS contracts - and knows the market benchmark for those tools - has everything needed to act. A manager working only from the total spend figure does not.
Step 5 – Act, Track, and Iterate
That SaaS example only creates value if it leads somewhere - a sourcing event, a renegotiation, a consolidation decision. Insights are only as useful as the actions they trigger. Category-level actions typically include:
- Targeted sourcing events for high-spend subcategories
- Contract renegotiations with performance benchmarks attached
- Supplier consolidation to reduce fragmentation and gain leverage
- Demand management where consumption patterns are wasteful
Each action should carry defined KPIs - cost savings realized, contract coverage achieved, supplier count reduced. The analytics cycle then restarts, using outcomes to sharpen the next round of analysis.
Category Management Analytics in Practice: A Walkthrough
Consider a mid-market industrial services company with roughly $200M in addressable indirect spend across ten categories, operating under a PE-mandated 90-day timeline to identify savings opportunities.
Step 1: Get the Data in Order
The first task is pulling three years of PO and invoice data from two ERP systems. What they find matches what McKinsey flags as typical for midsize companies - fragmented, incomplete spend data spread across unconnected sources. A significant share of transactions are uncategorized or miscoded.
The first three weeks go entirely to data cleansing and taxonomy mapping. No analysis happens until the data can be trusted.
Step 2: Find Where the Money Is Going
Once the data is clean, facilities and MRO stands out immediately. The team surfaces:
- Dozens of active suppliers with no preferred vendor program
- Substantial price variance for identical items across sites
- Minimal contract coverage across the category
McKinsey's MRO research puts 15% to 20% cost savings within reach through better data and supplier management - and this category fits the profile.
Step 3: Turn Analysis Into a Business Case
The team launches a targeted sourcing event for the top three spend subcategories within facilities. A supplier shortlist is built from performance and pricing data. Benchmark pricing produces a savings range that gives leadership a concrete business case - delivered within the 90-day window, with a data trail that supports the sponsor's value creation narrative.
The 90-day outcome wasn't magic. It came from scoping tightly, cleaning data fast, and resisting the urge to analyze everything at once - picking the one category where the numbers pointed clearly.
How Colab91 Can Help Build Your Category Analytics Capability
Building a full-scale category analytics function in-house - spend analysts, data engineers, category strategists, dashboard developers - is expensive, slow, and often impractical for mid-market companies that need results in months, not years.
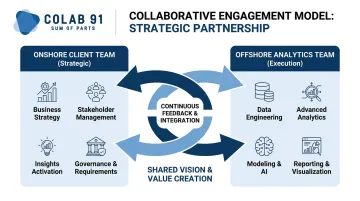
Colab91's model addresses this directly. The company builds dedicated offshore teams in India that function as strategic analytics hubs for mid-market and PE-backed clients - handling spend classification, category benchmarking, supplier performance tracking, and dashboard development while the client's onshore team retains strategic direction and stakeholder relationships.
What separates Colab91 from a generic offshore provider is domain depth. The leadership team - including Managing Partner Madhur Kabra, former Country Head of Impendi's India operations (acquired by Accenture) - previously scaled a procurement and analytics delivery center to 100+ practitioners, serving PE sponsors including Carlyle Group, TPG, Elliott, and BC Partners.
That track record means the team understands the pace, framing, and rigor that PE value-creation programs demand - not just the mechanics of spend classification.
Advisor Erika Jung brings a practitioner's perspective: a CPO who has led procurement transformation at PE-backed healthcare companies including Pediatric Associates (a TPG portfolio company). Her experience shapes how Colab91 structures engagements around what procurement leaders actually need to act on, not just what looks clean in a dashboard.
That division of labor is built into every engagement:
- Offshore team handles data-intensive work: cleansing, classification, benchmarking, visualization, and ongoing tracking
- Client onshore team owns category strategy, stakeholder communication, and sourcing decisions
- Engagement models are scoped to the client's spend base size, complexity, and timeline
For mid-market companies operating under PE timelines, this means category analytics capacity that's operational within weeks - without hiring, training, or standing up infrastructure internally.
Frequently Asked Questions
What is category management analytics?
Category management analytics is the practice of grouping procurement spend into defined categories and analyzing that data to identify savings opportunities, manage supplier performance, and improve sourcing decisions. It goes beyond spend reporting by connecting data to strategic action at the category level.
What are the 4 P's of category management?
The 4 P's are Product, Price, Placement, and Promotion. In procurement, these translate to assortment decisions, pricing strategy, supplier positioning, and demand management - the four levers a category manager uses to optimize category performance and total cost.
How is category management analytics different from spend analytics?
Spend analytics tells you what was spent and where. Category management analytics interprets that data through a strategic lens - evaluating supplier relationships, market benchmarks, contract compliance, and category-level opportunities for action. The difference matters because a category manager needs direction, not just description.
What are the key metrics tracked in category management analytics?
Core KPIs include spend under management, contract compliance rate, price variance across sites, supplier concentration, maverick spend percentage, and cost savings realized versus target. Best-in-Class procurement organizations average 91.5% spend under management and 73.5% compliant spend, according to Ardent Partners.
What data sources are used in category management analytics?
Typical inputs include ERP and P2P transaction data, contract repositories, supplier performance records, invoice data, and external market benchmarks. Integrating these sources is consistently the most challenging part of the process, given their different formats, coding conventions, and completeness levels.
How can mid-market companies build category analytics capabilities without a large procurement team?
Most close the gap by partnering with offshore analytics teams that bring domain expertise in procurement, reducing the time and cost of building capability internally. The key is finding a partner with category-specific knowledge, not just data processing capacity, so analysis translates into sourcing decisions rather than sitting in dashboards.